Download
1 / 17
170 likes | 298 Views
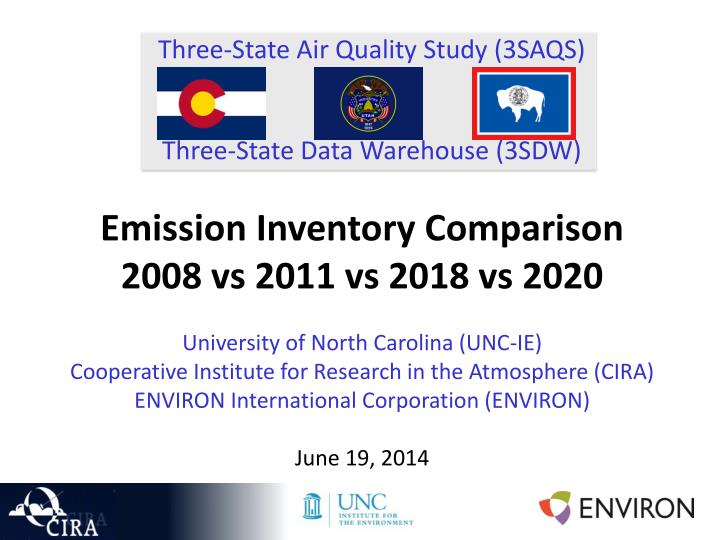
Three-State Air Quality Study (3SAQS) Three-State Data Warehouse (3SDW). Emission Inventory Comparison 2008 vs 2011 vs 2018 vs 2020 University of North Carolina (UNC-IE) Cooperative Institute for Research in the Atmosphere (CIRA) ENVIRON International Corporation (ENVIRON )

E N D
Three-State Air Quality Study (3SAQS)Three-State Data Warehouse (3SDW) Emission Inventory Comparison 2008 vs 2011 vs 2018 vs 2020 University of North Carolina (UNC-IE) Cooperative Institute for Research in the Atmosphere (CIRA) ENVIRON International Corporation (ENVIRON) June 19, 2014
3SAQS Inventory Comparison Overview • Objective: Compare the base and future year emission inventories for CO, UT, and WY to support the QA of the data and to inform the air quality evaluation • Display the differences (what), limited analysis for why • Why two different future years? • Inventories:
3SAQS Inventory Comparison Overview • Compare the inventories across 15 sectors: • Aircraft/Locomotive/Marine (ALM) • Nonroad Mobile • Onroad Mobile • EGU Point • nonEGU Point • Nonpoint • Residential Wood Combustion (RWC) • Livestock ammonia • Fertilizer Ammonia • Area Oil & Gas • Point Oil & Gas • Fire • Fugitive Dust • Windblown Dust • Biogenic
State Base Year Differences(O&G methane excluded from chart)
State Base Year Differences(O&G methane excluded from chart)
State Base Year Differences(O&G methane excluded from chart)
State Base->Future Differences(O&G methane excluded from chart) Very similar trends from base to future year, despite different starting and ending years
State Base->Future Differences(O&G methane excluded from chart) Very similar trends from base to future year, despite different starting and ending years
State Base->Future Differences(O&G methane excluded from chart) Notable differences in the trends for non-EGU point and area O&G
Colorado Oil and Gas Methane 2008 2011 • Over 13 Mtons/year of CH4 in 2011 inventory from fixed roof tank condensates • 483,000 tons/year of CH4 from all sources in 2008 inventory • ~1.4 x more VOC in 2011, ~30x more CH4 in 2011 • Driven by increase in fixed roof tank emissions in the Piceance Basin (application of the ROG2TOG multiplier for condensates = 449 using profile ID SSJCB)