Download
1 / 3
30 likes | 143 Views
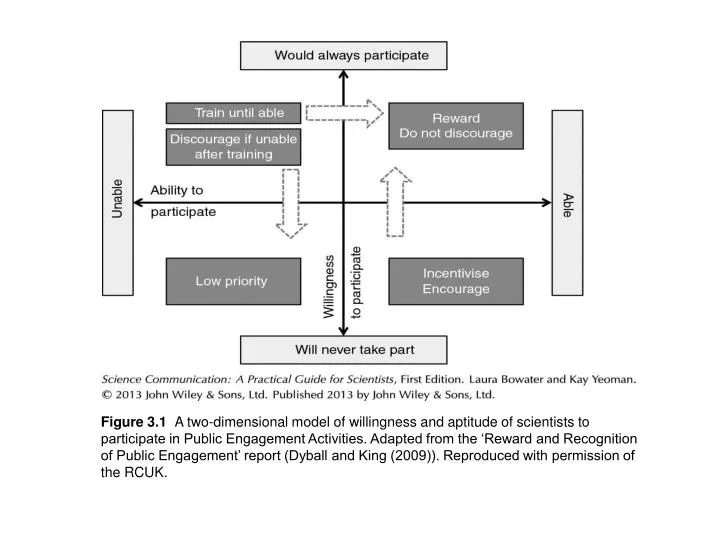
Figure 3.1 A two-dimensional model of willingness and aptitude of scientists to participate in Public Engagement Activities. Adapted from the ‘Reward and Recognition of Public Engagement’ report (Dyball and King (2009)). Reproduced with permission of the RCUK. Figure 3.2 Mad scientist.

E N D
Figure 3.1 A two-dimensional model of willingness and aptitude of scientists to participate in Public Engagement Activities. Adapted from the ‘Reward and Recognition of Public Engagement’ report (Dyball and King (2009)). Reproduced with permission of the RCUK.
Figure 3.3 The graph represents the lifetime development of a full-time sciencecommunicator. The inset box shows the much smaller amount of time and developmentthat may apply to science communication when practiced (and taught as a sideline) to themain career of a scientist with initial training. However, with support and planningthroughout your career, further progress towards ‘expert’ can be achieved. Adapted from‘Towards a professional framework for scientists involved in public engagement work’, areport prepared for the Wellcome Sanger Institute by A. Macleod (2010). Reproduced bypermission of the Wellcome Trust Sanger Institute.