Download
1 / 1
30 likes | 158 Views
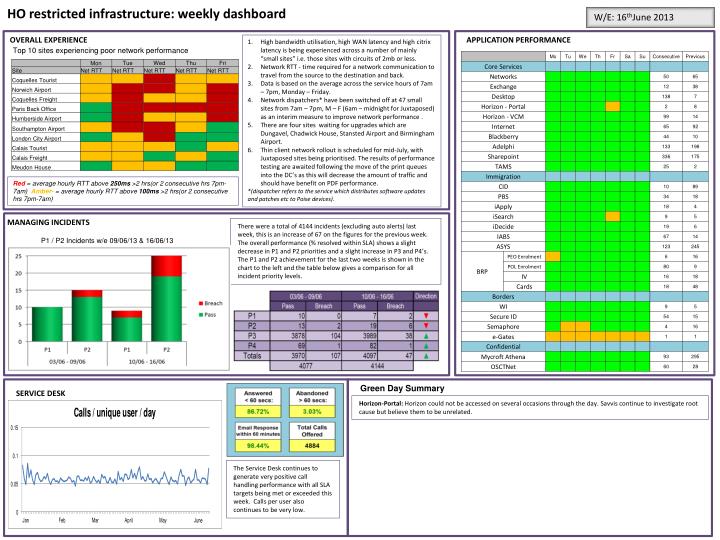
W/E: 16 th June 2013. HO restricted infrastructure: weekly dashboard. OVERALL EXPERIENCE. APPLICATION PERFORMANCE. High bandwidth utilisation, high WAN latency and high citrix latency is being experienced across a number of mainly “small sites” i.e. those sites with circuits of 2mb or less.

E N D
W/E: 16thJune 2013 HO restricted infrastructure: weekly dashboard OVERALL EXPERIENCE APPLICATION PERFORMANCE High bandwidth utilisation, high WAN latency and high citrix latency is being experienced across a number of mainly “small sites” i.e. those sites with circuits of 2mb or less. Network RTT - time required for a network communication to travel from the source to the destination and back. Data is based on the average across the service hours of 7am – 7pm, Monday – Friday. Network dispatchers* have been switched off at 47 small sites from 7am – 7pm, M – F (6am – midnight for Juxtaposed) as an interim measure to improve network performance . There are four sites waiting for upgrades which are Dungavel, Chadwick House, Stansted Airport and Birmingham Airport. Thin client network rollout is scheduled for mid-July, with Juxtaposed sites being prioritised. The results of performance testing are awaited following the move of the print queues into the DC’s as this will decrease the amount of traffic and should have benefit on PDF performance. *(dispatcher refers tothe service which distributes software updates and patches etc to Poise devices). Top 10 sites experiencing poor network performance Red = average hourly RTT above 250ms >2 hrs(or 2 consecutive hrs 7pm-7am) Amber- = average hourly RTT above 100ms >2 hrs(or 2 consecutive hrs 7pm-7am) MANAGING INCIDENTS There were a total of 4144 incidents (excluding auto alerts) last week, this is an increase of 67 on the figures for the previous week. The overall performance (% resolved within SLA) shows a slight decrease in P1 and P2 priorities and a slight increase in P3 and P4’s. The P1 and P2 achievement for the last two weeks is shown in the chart to the left and the table below gives a comparison for all incident priority levels. P1 / P2 Incidents w/e 09/06/13 & 16/06/13 Green Day Summary SERVICE DESK Horizon-Portal: Horizon could not be accessed on several occasions through the day. Savvis continue to investigate root cause but believe them to be unrelated. The Service Desk continues to generate very positive call handling performance with all SLA targets being met or exceeded this week. Calls per user also continues to be very low.