Download
1 / 24
240 likes | 408 Views
How A Consumer Can Measure Elasticity for Cloud Platforms. Sadeka Islam 1,2 , Kevin Lee 1,2 , Alan Fekete 1,3 , Anna Liu 1,2 National ICT Australia (NICTA) 1 , University of New South Wales (UNSW) 2 , University of Sydney (USYD) 3. Our research agenda.

E N D
How A Consumer Can Measure Elasticity for Cloud Platforms Sadeka Islam1,2, Kevin Lee1,2, Alan Fekete1,3, Anna Liu1,2 National ICT Australia (NICTA)1, University of New South Wales (UNSW)2, University of Sydney (USYD)3
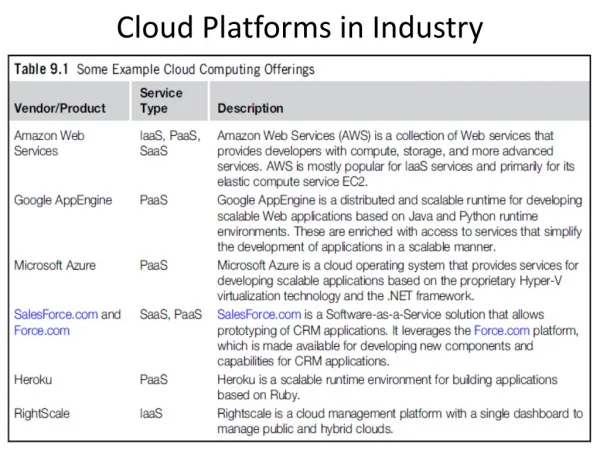
Our research agenda • Help consumers in use of cloud platforms • Decision-making • What cloud is good for • What concerns need to be addressed • Processes • Design • Development • Governance • Monitoring/tuning • Dashboard tool design • Focus on information interface provided by cloud platforms • What can consumer measure? • What can consumer control? • “Use-inspired research”
Elasticity • Elasticity is a key distinguishing feature of cloud • What is elasticity? “the ability of software to meet changing capacity demands, deploying and releasing necessary resources on-demand” [Yefim et al.] • Cloud providers claim to provide ‘elastic’ solutions • An elastic platform offers responsive resource provisioning/deprovisioning • Supply should closely track varying demand for resources • Contrast with in-house IT • Weeks/months to provision systems • Long periods of wasted resources, and also potential for serious losses if demand spikes above what was provisioned • Challenge: No existing metrics to quantify elasticity
Elasticity Measure • What is our goal? • Measure and compare elasticity of cloud providers • e.g., how elastic is EC2? Is it more elastic than Azure instance? Under what configurations? • Do this as consumer (use information provided through platform’s API)
Consumer’s benchmark • Consumer will submit requests to platform following some workload growth/decay patterns • If platform provides API to scale out/back, then consumer can request this as part of workload • Consumer will observe platform through publicly available monitoring/reporting mechanisms • Eg charges levied • Eg reported utilization • Note: platform can’t game the measurement, as it doesn’t know that this is a benchmark rather than any ordinary workload
Our approach - overview • Submit a workload that follows some pattern • Eg sinusoidal, with given period and trough-to-peak growth • Defined by number of requests per second, and type of requests • Measure the demand on the platform • Utilization is a good proxy, except when underprovisioned • Measure the supply • What the consumer is charged for • Measure the latency and other QoS aspects • Calculate a penalty for underprovisioning • Convert each QoS violation to a financial penalty • Calculate a penalty for overprovisioning • Excess of charged resources of what is needed (utilized) • Combine penalties for an overall score
Our Approach - details • Key Features: • Economic model (in terms of financial cost) • Measure over-provisioning based on excess charging (e.g., excess CPU cycles, memory, etc.) • Measure under-provisioning through QoS requirements (e.g., 90% of requests with less than 500ms response time) • Distinguish between charged and allocated resources (i.e., resource and pricing model granularity) • Evaluation based on a range of workload patterns (e.g., Sine curve, exponential, linear, random, etc.) • Final score relative to baseline (SPEC approach) • Impact of rule configurations on elasticity (e.g., +1 instance when CPU > 80% & -1 instance when CPU < 30%)
Related Work • Kossman’s group at ETHZ[1] • Research project on benchmarking cloud platforms • Look at a wide variety of measures • Omit to look at speed of responding to change in workloads, nor workloads that shrink and grow • Weinman’s numeric measurement on elasticity[2] • Considers arbitrary workload patterns • Constructs a numeric score for how a platform handles a workload • Reflects impacts of both over- and under-provisioning • Pure theoretical account
Penalty for Over-provisioning • Input functions: • Ri(t) and Di(t) denote the available supply and demand curves respectively • Mi(t) denotes the chargeable supply • ci(t) indicates what the consumer must pay for each resource unit • Penalty calculation:
Penalty for Under-provisioning • Input functions: • pq(t) reflects the amount of unsatisfactory behaviour observed on the platform at time t • poptq(t) denotes the limit of the amount of unsatisfactory behaviour observed in a system that is statically allocated with K resources • fq takes the observed measurement of unsatisfactory behaviour and maps this to the financial impact on the consumer • Penalty calculation:
Total Penalty Rate for an Execution • Calculate the overall penalty score P(ts,te) accrued during an execution from ts till te • Sum of the penalties from both over- and under-provisioning • Expressed in dollars per hour • A lower score indicates a more elastic response to the given workload • Penalty calculation:
Single Figure of Merit for Elasticity • Take into account a suite of different workloads • Combine measured penalty rates from several workloads into a single summary number • Follow the approach used by the SPEC family of benchmarks • Choose a reference platform • Measure each workload on that platform and platform of interest • Take ratio of the penalty rate on the platform we are measuring to the reference platform • Combine the ratios for the different workloads by geometric mean
Concrete Choices for an Elasticity Benchmark • Over-provisioning penalty • Deal with a single resource (CPU capacity, relative to a standard small EC2 instance) • Financial charge is $0.085 per hour per instance • Under-provisioning penalty • Used the following two QoS aspect: • (Latency) No penalty as long as 90% of requests have response time up to 3 seconds; otherwise, a cost penalty, 12.5c will apply for each 1% of additional requests (beyond the allowed 10%) that exceed the 3 seconds latency • (Availability) Cost penalty of 10c will apply for each 1% of requests that fail completely (i.e. dropped or timed out)
Concrete Choices for an Elasticity Benchmark (cont’d) • A suite of 10 different workloads which grow and shrink in a variety of shapes: • Sinusoidal workload • Sinusoidal workload with plateau • Exponentially bursting workload • Linearly growing workload • Random workload
Case Study: Sanity Checking • Trends in Elasticity Scores • Penalty varies with the type of workload • Overall penalty is dominated by loss of revenue due to under-provisioning • For sinusoidal workload patterns, the overall penalty declines with the increase in waveperiod • Insertion of plateau to sinusoidal workload wipes out resource reuse phenomena • EC2 seems to be inelastic to random and highly fluctuating workload patterns
Experimental Results • Reflects higher under-provisioning penalty between 15-30 mins • Shows higher over-provisioning penalty between 35-45 mins • Chargeable supply always higher than available supply
Experimental Results • High under-provisioning penalty due to dropped requests and time-outs • Unable to cope with fast-paced workload patterns
Experimental Results • Resource trapping • Unable to cut back to its initial state after a temporary workload burst • Compare between two rule sets • Higher instance increments works better with sharper workload increase
Experimental Results: Impact of Scaling Rules on Elasticity • Compare between two scaling rules in terms of elasticity • Compare in a per workload basis (e.g. for sine_30, 158.01/301.57 = 0.52) • Calculate Single Figure of Merit from the suite of workloads • Geometric Mean is 0.65 < 1 (hence Rule Set 2 yields greater elasticity than Rule Set 1)
Conclusion • Small and medium enterprises are heading towards the cloud for many reasons • Exploits elasticity when facing with time-varying workload that may be unpredictable • Choose appropriately between platforms • We offer the first concrete proposal giving a numeric score for elasticity • Measurement by consumer, using information available • Refined Weinman’s theoretical work • Especially new ways to use SLAs to determine penalties for under-provisioning • Showed that one gets poor elasticity when following a widespread ruleset for provisioning and deprovisioning
Future Work • Extend our measurements to other platforms with a wider range of features • Consider workloads that grow much further than our current set • Try examples with a greater range of SLAs and opportunity cost functions • Make benchmark running as automatic as possible • Consumer could download a package to get a score for each platform
Recent Cloud Computing Research at NICTA • Van T. K. Tran, Kevin Lee, Alan Fekete, Anna Liu, Jacky Keung, “Size Estimation of Cloud Migration Project with Cloud Migration Point (CMP)” (ESEM-11) • Sadeka Islam, Jacky Keung, Kevin Lee, Anna Liu, “Empirical Prediction Models for Adaptive Resource Provisioning in the Cloud” (FGCS journal) • Hiroshi Wada, Alan Fekete, Liang Zhao, Kevin Lee, Anna Liu, “Data Consistency Properties and the Trade-offs in Commercial Cloud Storage: The Consumers’ Perspective” (CIDR-11)
References • D. Kossmann, T. Kraska, and S. Loesing. Anevaluation of alternative architectures for transaction processing in the cloud. In Proceedings of the 2010 international conference on Management of data, SIGMOD ’10, pages 579–590, New York, NY, USA, 2010. ACM. • J. Weinman. Time is Money: The Value of ”On-Demand”, Jan. 2011. Working paper (Jan 2011), from http://www.JoeWeinman.com/Resources/Joe_Weinman_Time_Is_Money.pdf