Download
1 / 33
350 likes | 533 Views
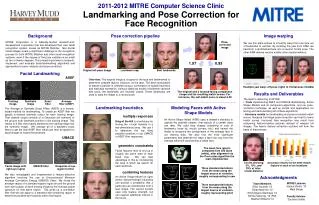
Matching 3D Models With Shape Distributions. Robert Osada, Tom Funkhouser Bernard Chazelle, and David Dobkin Princeton University. Shape Similarity. Determine similarity between 3D shapes. Computer Graphics. Computer Vision. Computational Biology. [Insulin, PDB]. [Caltech].

E N D
Matching 3D Models With Shape Distributions Robert Osada, Tom Funkhouser Bernard Chazelle, and David Dobkin Princeton University
Shape Similarity • Determine similarity between 3D shapes ComputerGraphics ComputerVision Computational Biology [Insulin, PDB] [Caltech]
Previous Work in 2D • Shape representations • Fourier analysis [Arbter90] • Turning function [Arkin91] • Size function [Uras95] • Metrics for comparing curves • Hausdorff • Fréchet • Bottleneck • etc.
Previous Work in 3D • High-level representations • Generalized cylinders [Binford71] • Medial axis [Bardinet00] • Skeletons [Bloomenthal99] • Statistical • Moments [Reeves45, Prokop92] • Crease angle [Besl94] • Shells decomposition around centroid [Ankerst99] • Extended Gaussian Images [Horn84] • etc.
Desired Properties • Match global properties of shape • Invariance • Rotation, translation, scale, mirror • Robustness • Noise, cracks, insertions and deletions • Practicality • Concise representation • Efficient comparison • Working with degenerate models
Our Approach • Shape distributions • Concise shape descriptor • Common parameterization • Function of random points Random sampling Parameterization ShapeDistribution 3D Model
Our Approach Parameterization Shape Function SimilarityMeasure Parameterization 3D Model Shape Distribution
Issues • Which shape function? • How to compare shape distributions? Parameterization SimilarityMeasure Parameterization
Issues • Which shape function? • How to compare shape distributions? Parameterization SimilarityMeasure Parameterization
Which Shape Function? • Computationally simple options (~ 1s) • Based on random points • Angles, distances, areas, volumes A3 D1 D2 D3 D4 [Ankerst99]
Shape Function – D2 • Distance between two random points on surface Line Segment Circle Triangle Cube Cylinder Sphere Two adjacent spheres Two spheres moving apart
Which Shape Function? • Sneak preview
Shape Function – Key Questions • Invariant? • Rotation, translation, mirror (not scale) • Robust? • Noise, cracks, insertions and deletions • Descriptive?
Issues • Which shape function? • How to compare shape distributions? Parameterization SimilarityMeasure Parameterization
Comparison • Normalize for scale • Compare shape distributions Parameterization Parameterization
Normalization for Scale max mean search
Compare shape distributions • Computationally simple options (~ .1ms) • Ln norms of densities (PDF) orcumulative densities (CDF) • More complex options • Earth mover’s distance, Bhattacharyaa distance. PDF CDF
Experimental Results • Goal is to address the following: • Is the method robust? • How well does it classify? PDF L1 L2 L CDF L1 L2 L A3 D1 D2D3 D4 Max Mean Search
Robustness Experiment • 10 Models Car Chair Human Missile Mug Phone Plane Skateboard Sub Table
Robustness Experiment • 6 Transforms • Rotate, scale, mirror, noise, delete, insert • Total of 70 models 1% Noise 5% Deletion
Robustness Results • Resulting distributions stable 7 Missiles 7 Mugs Probability Distance
Classification Experiment • 133 Models categorized into25 Groups • Large variety • within a group • among groups 4 Mugs 6 Cars 3 Boats
5 Animals 4 Balls 2 Belts 3 Blimps 3 Boats 6 Cars 8 Chairs 3 Claws 4 Helicopters 11 Humans 3 Lamps 3 Lightnings 6 Missiles 4 Mugs 4 Openbooks Classification Results
Classification Results Probability Distance
Line Segment Circle 5 Animals 4 Balls 2 Belts 3 Blimps 3 Boats Triangle Cube 6 Cars 8 Chairs 3 Claws 4 Helicopters 11 Humans Cylinder Sphere Two adjacent spheres Two spheres moving apart 3 Lamps 3 Lightnings 6 Missiles 4 Mugs 4 Openbooks Classification Results
Query NearestNeighbor 1stTier 2ndTier Results … Classification Results • Avoid bias due to varying group sizes
Classification Results • Similarity matrix • Nearest Neighbor • 1st Tier • 2nd Tier • Blocks • Tanks • Mugs • Humans • Airplanes • Boats
Comparison to Moments • Method • Align 1st moments (translation) • Align 2nd moments (rotation and scale) • Compare using remaining moments (L2)
Conclusion – Properties • Match global properties of shape • Invariance • Rotation, translation, scale, mirror • Robustness • Noise, cracks, insertions and deletions • Practicality • Concise representation • Efficient comparison • Works for degenerate models
Conclusion – Key Ideas • Sampling gives common parameterization • Simplifies comparison • Comparing distributions is fast and easy • Avoids registration, correspondence, etc. • Simple shape functions are discriminating • Method suitable as preclassifier
Future Work • Use a larger and more controlled database • Combine shape distributions with other classifiers into a working shape-based retrieval system
Thank you • Sloan Foundation • NSF