Download
1 / 10
100 likes | 111 Views
3.1 Exponential Functions and Their Graphs. The exponential function f with base a is denoted by f(x) = a x. and x is any real number. Graph y = 2 x. x y. -2 -1 0 1 2. 2 -2 =. 2 -1 =. 1 2 4. y = 2 -x. x y. -2 -1 0 1 2. 4 2 1 ½ ¼. y = 2 x + 1. x y. -2 -1

E N D
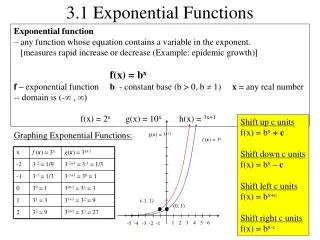
3.1 Exponential Functions and Their Graphs The exponential function f with base a is denoted by f(x) = ax and x is any real number.
Graph y = 2x x y -2 -1 0 1 2 2-2 = 2-1 = 1 2 4
y = 2-x x y -2 -1 0 1 2 4 2 1 ½ ¼
y = 2x + 1 x y -2 -1 0 1 2 5/4 3/2 2 3 5 Graph shifted up one.
y = 2x+1 x y -2 -1 0 1 2 ½ 1 2 4 8 -3 ¼ Graph shifted left one.
y = 2x y = -2x x y -2 -1 0 1 2 -1/4 -1/2 -1 -2 -4 Reflects about x-axis
The number e e = 2.71828… y = ex x y -2 -1 0 1 2 1/e2 1/e 1 e e2 = 7.389
Formulas for Compound Interest For n compoundings per year: yearly 1 monthly 12 semi-ann 2 daily 365 For continuous compounding:
Ex. A total of $12,000 is invested at an annual percentage rate of 9%. Find the balance after 5 years if it is compounded a. quarterly b. continuously A = 12,000e.09(5) A = $18,819.75 A = $18,726.11