Download
1 / 29
290 likes | 290 Views
This text discusses the estimation of heritability and repeatability in milk yield traits in dairy cattle. It covers factors affecting milk yield measurements and the analysis of variance for repeated records. It also includes calculations and examples for better understanding.

E N D
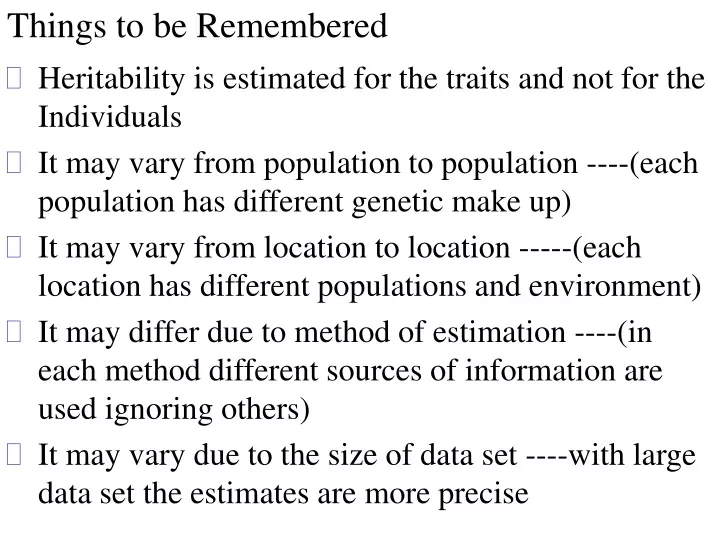
Things to be Remembered Heritability is estimated for the traits and not for the Individuals It may vary from population to population ----(each population has different genetic make up) It may vary from location to location -----(each location has different populations and environment) It may differ due to method of estimation ----(in each method different sources of information are used ignoring others) It may vary due to the size of data set ----with large data set the estimates are more precise
Some environmental factors affecting milk yield Measurements such as milk yield in dairy cattle are affected by influences such as Age of the cow at calving Year and Season of the calving Preceding dry period Frequency of milking Length of lactation Lactation number Corrections are made to eliminate these effects
PaternalHalf-sib Analysis • Sires are very important and must be known. • Data on half-sibs are analyzed to estimate intra sire correlation (t). • Half sibs have only one forth of their genes in common • Paternal half sibs used _____a few maternal half sibs in a set • The intra sire correlation (t) between paternal half sibs can be computed as a ratio of the components of variance. t = S2 S2 + e2
Half-sib correlation • Since half sibs have only one forth of their genes in common, the S2 represents A2 /4. • h2 is computed by multiplying the half sib correlation “t” by four. h2 = 4 (t)
REPEATABILITY • The concept of repeatability is closely allied to the concept of heritability • The traits expressed several times during an animal’s lifetime • Wool yield, weaning weights of lambs for sheep and milk yield in dairy cattle • It determines the upper limit of heritability • May be defined as the correlation between repeated records • Regression of past performance on future performance
Repeatability and Heritability R = (A2) + (D2) + (I2) + (PE2) (A2) + (D2) + (I2) + (TE2) +(PE2) H2 = (A2) + (D2) + (I2) (A2) + (D2) + (I2) + (TE2) +(PE2) h2 = (A2) (A2) + (D2) + (I2) + (TE2) +(PE2)
Repeatability • Neither the genes nor the gene combinations influence the successive expressions of a trait • Repeatability can be computed as the regression of subsequent performance on past performance. • In may be derived from an analysis of variance as an intra-class correlation among records or observations of traits on the same individual. • Knowledge of repeatability estimates for various traits may be used in selecting for future performance.
Repeatability • When the repeatability estimate for a trait is high, culling on the basis of the first record should be effective in improving the overall record of the flock in future • Offspring from the superior individuals should be given preference when selection is made for replacement stock. • Repeatability estimates give an indication of how many records should be obtained on an individual before culling • Used to estimate the probable producing ability of individuals with repeated observations
Av. repeatability estimates for various traits in dairy cattle Traits # Studies Average Range milk yield 17 0.54 0.30 - 0.71 Lactation length 12 0.25 0.09 - 0.53 Dry period 7 0.28 0.01 - 0.34 Calving interval 22 0.29 0.07 - 0.50 Service period 5 0.11 0.08 - 0.34 Services/concep 2 0.07 0.07 - 0.09
Analysis of variance for a trait measured several times on the same individual SOV df S Sq M Sq Exp M Sq B C n –1 (Ci)2/m – CF BC/df W2+ mB2 W C n (m-1) TSS – BCS WC/df W2 Total N-1 Xi2- CF
w2is a measure of the within-animal variance B2 is a measure of the between-animal variance which estimates all the genetic variance and the portion of the environmental variance peculiar to the individual n = the number of animals/cows m = the number of times each trait is measured N = total number of observations
SumXi = (X1+X2+X3……….Xn) CF = (Xi)2 /N TSS = Xi2- CF Bet SS = (Cow)2/n - CF Within SS = TSS – Bet. SS Bet. MS = (Bet. SS)/D.F Within MS = (Within SS)/D.F
Milk production records for repeatability estimation Cow 1 Cow 2 Cow 3Xi X2 Xi X2 Xi X2 1 636 5 25 5 25 2 5 25 4 16 8 64 3 3 9 2 4 4 16 4 4 16 4 16 6 36 18 86 15 61 23 141
ANOVA for repeatability estimation SOV DF S Sq M Sq Exp M Sq B C 2 8.16674.0833W2+ mB2 W C 9 18.500 2.055 W2 Total 11 26.667
Different Calculations for ANOVA N = 12 n = 3 m = 4 Sum Xi = 56 CF = 261.333 TSS = 26.667 Bet SS = 8.167 WSS = 18.500 BETMS = 4.083 = W2+ mB2 WMS = 2.055 = W2
In Terms of Variance Components T2 = w2 + B2 Repeatability B2 R = w2+ B2 Cow Var (B2) = 0.507 Repeatability = 0.198
Milk production records for repeatability estimation Cow 1 Cow 2 Cow 3 Xi Xi Xi 1 1025 1125 1450 • 1120 1295 1652 3 1130 1350 985 4 1025 1248 1036 5 990 1540 1125
Milk production records for repeatability estimation Cow 1 Cow 2 Cow 3 Xi Xi Xi 1 1221 689 1465 2 1698 1400 1358 3 1989 1358 1087 4 1345 1424 1354
Milk production records for Heritability estimation S1 S2 S3 Xi Xi Xi 1 980 1652 1569 2 1025 1568 1254 3 985 1920 1789 4 1090 1867 2546 5 1254 2154 1560 6 1568 2650 1294 7 1520 2145 1550 8 1234 2014 1397
Milk production records for Heritability estimation S1 S2 S3 Xi Xi Xi 1 874 1654 1569 2 987 1587 1254 3 851 1895 1789 4 1024 1897 2546 5 1279 2045 1560 6 1230 2563 1294 7 1428 1987 1550 8 1158 1985 1397
Correlations • Many characteristics among animals are not independent. • High wool weight is associated with long staple length • Higher age at first calving with high milk yield • Knowledge of the direction and degree of such associations is important in formulating efficient breeding/mating plans • Not only the degree but also the direction of such associations may change under selection programmes.
Correlations • The environmental component of the correlation results from the environment shared by the two traits, for example sheep raised on poor pasture or rangelands may get poor nutrition and their live weights and wool yield are both affected. These effects are not passed on to the next generation.
Phenotypic Correlation • The phenotypic correlation between any two traits has both genetic as well as environmental components. • Statistically significant correlation means that there is a high probability of an association between the traits under consideration, of the magnitude indicated by the sample value. • Tables are available which give the probability of occurrence of correlations of a given magnitude for a given number of pairs
Genetic correlation • The genetic cause of correlation is chiefly pleotropy, means that the same gene may affect more than one trait • It may also be due to the linkage of genes on the same chromosome with the degree of association dependent upon the distance between the two loci. • Such associations might decrease in every generation, as the linked genes would break up. • If the gene is segregating it causes simultaneous variation in the characters it affects. • For example, genes that increase growth rate increase both stature and weight, so they tend to cause correlation between the two traits.
Genetic Correlations • Genes that increase fatness, however, influence weight without influencing stature, and are therefore, not a cause of correlation. • The degree of correlation arising from pleotropy expresses the extent to which two characters are influenced by the same genes. • Some genes may increase both characters, while others increase one and decrease the other; the former tend to cause positive correlation, the latter a negative one. • It means that selection for one trait will influence the other correlated trait as a correlated response.
Genetic Correlations • The genetic correlation expresses the extent to which two measurements reflect what is genetically the same character. • Estimates of genetic correlations are strongly influenced by gene frequencies, so they may differ markedly in different populations
Phenotypic and Genetic correlations in a herd of Sahiwal cattle Traits correlatedPheno.Genet. FLMY & 1st Lact. Length 0.353 0.483 FLMY & first C. I 0.394 0.457 FLMY & first dry period 0.354 0.493 FLMY & lifetime milk yield 0.022 0.005 AFC & first lactation length 0.148 0.993 AFC & first service period 0.295 0.502 AFC & lifetime milk yield -0.527 -0.999 AFC & herd life 0.322 0.441 AFC & FLMY 0.667 0.605 AFC & longevity 0.017 -0.06
Use of Computer in data handling and analysis • · Microsoft Excel • · Q. Pro • Software Used • Harvey’s Least Squares Maximum Likelihood (LSMLMW) (1987, 1988, 1990) • W. R. Harvey (US) • Environmental effects • Genetic parameters based on Sire model
Software Used • Derivative Free Restricted Maximum Likelihood (DFREML) (1991,1997,1998,2000) • o K. Meyer (UK) • o Basically for variance components estimation • o Heritability, Repeatability, Genetic correlations • o Estimation of Breeding Values • Based on BLUP using Individual Animal Model • Most modern, utilizing all available information