Download
1 / 39
400 likes | 409 Views
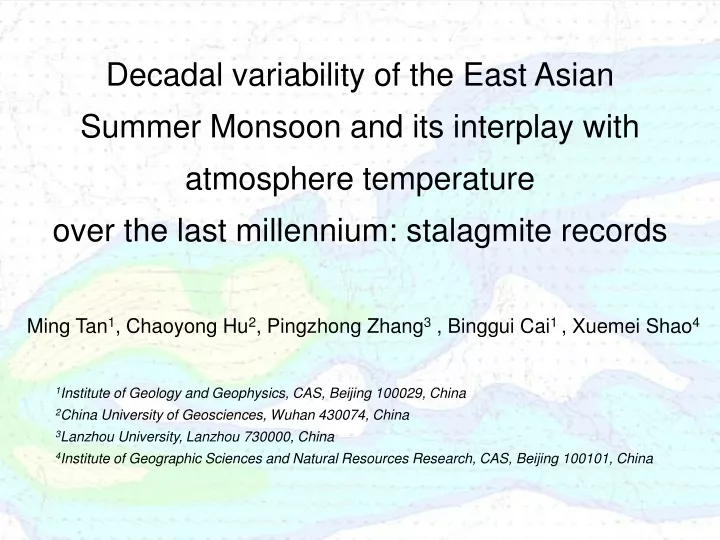
Decadal variability of the East Asian Summer Monsoon and its interplay with atmosphere temperature over the last millennium: stalagmite records. Ming Tan 1 , Chaoyong Hu 2 , Pingzhong Zhang 3 , Binggui Cai 1 , Xuemei Shao 4. 1 Institute of Geology and Geophysics, CAS, Beijing 100029, China

E N D
Decadal variability of the East Asian Summer Monsoon and its interplay with atmosphere temperature over the last millennium: stalagmite records Ming Tan1, Chaoyong Hu2, Pingzhong Zhang3 , Binggui Cai1 , Xuemei Shao4 1Institute of Geology and Geophysics, CAS, Beijing 100029, China 2China University of Geosciences, Wuhan 430074, China 3Lanzhou University, Lanzhou 730000, China 4Institute of Geographic Sciences and Natural Resources Research, CAS, Beijing 100101, China
stalactite column stalagmite Cave formation ——speleothem
rain soil H2O + CO2→H2CO3 CaCO3+ H2CO3→ Ca2+ + 2HCO3- stalactite Ca2+ + 2HCO3-→ CaCO3+H2O + CO2 flowstone column stalagmite How speleothems form and contain climate signal?
Outline • What we have done with stalagmites? • (1) High precision dating by annual layer counting and Th-230 dating • (2) Quantitatively reconstructing climate with annual layer thickness • Large-scale climate signal: stalagmite oxygen isotopes (SOI) • Calibrating the SOI with the East Asian Summer Monsoon Index (EASMI) • Reconstructing temperature over the last millennium for China • 5. Comparison of the EASMI and the temperature over the last millennium
Sample Sites Water Cave Qilian tree ring site Shihua Cave Wanxiang Cave Hulu Cave Heshang Cave Dongge Cave Xiangshui Cave 1000km
1. What we have done with stalagmites? (1) High precision dating by annual layer counting and Th-230 dating (2) Quantitatively reconstructing climate with annual layer thickness
230Th dating (years before 2007 AD) VS. Layer counting 242.9 242.9 0.9 0.9 ± ± 248.0 248.0 1.0 1.0 ± ± 250.9 250.9 1.1 1.1 ± ± 256.7 256.7 1.0 1.0 ± ±
1961 1960 1959 6cm 1958 1957 1956 1955 1954 1953 1952 1951 1950 1949 1948 1947 1mm Stalagmite annual layers from Beijing Shihua Cave
2650-year warm season temperature reconstruction for Beijing(BC665-AD1985) derived by calibrating the stalagmite annual layer thickness with meteorological records
2. Large-scale climate signal: stalagmite oxygen isotopes (SOI)
The oxygen isotope of stalagmite from Dongge Cave is consistent with that from Hulu Cave within 5000 years (Yuan et al. Science, 2004) Large Scale Climate Signal !
Comparison of stalagmite oxygen isotope records from the south to the north of China, the oxygen isotope ratios become lighter from south to north This pattern matches the observed pattern of the summer monsoon. Starting from the South China Sea and going northward, the summer monsoon supplies rainfall from the south to the north, and oxygen isotope ratios become lighter with precipitation. All of them contain a multi-millennial trend towards heaver ratios since 9000 Yr BP, this suggests that the change in patterns recorded in these ratios in Eastern China results from a single water source. Water Cave 41°17‘N Shihua Cave 39°47‘N δ18O (PDB‰) Dongge Cave 25°17‘N Xiangshui Cave 25°15‘N Year before 2000AD Synthesized 1000-year temperature record derived by calibrating the BQ with the bm. The thick line shows 11-year running mean value.
Temperature ? Precipitation ? Monsoon ? Stalagmite oxygen isotopes δ18O
3. Calibrating the SOI with the East Asian Summer Monsoon Index (EASMI)
So many East Asian summer monsoon indices (EASMI) 1. 郭其蕴,东亚夏季风强度指数及其变化的分析.地理学报,1983,38(3),207-217 2. 施能,杨永胜,1873-1996年东亚冬、夏季风强度指数及其主要特征,南京气象学院学报,1998,21(2),208-214 3. 黄刚,严中伟,东亚夏季风环流异常指数及其年际变化,科学通报,1999,44(4),421-424 4. 祝从文,何金海,吴国雄. 东亚季风指数及其与大尺度热力环流年际变化关系. 气象学报, 2000,58(4):391-402 5. 王亚非,张雁,陈菊英,一个能反映梅雨现象的东亚夏季风指数,气候与环境研究,2001,6 (2),146-152 6. 乔云亭,陈烈庭,张庆云,东亚季风指数的定义及其与中国气候的关系,大气科学,2002,26(1)69-82 7. Jianping Li and Qingcun Zeng, A unified monsoon index. GEOPHYSICAL RESEARCH LETTERS, 2002, 29(8), 10.1029/2001GL013874, 8. 琚建华,钱诚,曹杰,东亚副热带夏季风指数研究,中国气象学会2003年年会 9. 张庆云,陶诗言,陈烈庭,东亚夏季风指数的年际变化与东亚大气环流,气象学报,2003,61(5)559-568 10. 廉毅,沈柏竹,高枞亭,关于确定东亚夏季风强度指数的探讨,气象学报,2004,62(6) 11. HUANG Gang, An Index Measuring the Interannual Variation of the East Asian Summer Monsoon—The EAP Index, ADVANCES IN ATMOSPHERIC SCIENCES, 2004, 21(1) 41–52 12. 李建平,曾庆存,一个新的季风指数及其年际变化和与雨量的关系,气候与环境研究,2005, 10(3), 351-365 13. 赵平,周自江,东亚副热带夏季风指数及其与降水的关系,气象学报,2005,63(6),933-941 14. .梁萍,汤绪,何金海,陈隆勋,用水汽输送表征的东亚副热带夏季风指数研究,热带气象学报,2007,23 (5),467-473
Studies on the Variations of East-Asian Summer Monsoon during AD1873~2000 Guo Qiyun, Cai Jingning, Shao Xuemei and Sha wanying Chinese Journal of Atmospheric Sciences, 2004 Summer monsoon index Year AD
Comparison the EASM and the temperature of China over the last century (different decadal trends) Annual temperature of China by Wang et al. 1998 EASMI by Guo et al. 2004 Temperature anomaly (℃) Summer monsoon index Year AD Year AD
Oxygen isotopes of stalagmites both from Guizhou (blur) and Beijing (red) show a trend of heavier over the last century δ18O of stalagmite from Shihau Cave (PDB‰) δ18O of stalagmite from Dongge Cave (PDB‰) Thick lines: 3d-polynomial Year AD
Oxygen isotopes of stalagmites both from Hubei (blue) and Beijing (red) show a trend of heavier over the last 200 years δ18O (PDB‰) Year AD
Relationship between the oxygen isotope of the stalagmite TS9501 from Shihua Cvae and the EASMI TS9501 EASMI Summer monsoon index δ18O (PDB‰) r = -0.415 n = 49 Year AD
Relationship between the oxygen isotope from the stalagmite HS4 and the EASMI HS-4 EASMI Summer monsoon index δ18O (PDB‰) r = -0.50 n = 99 (1902-2000) 5-year running:-0.64 11-year running: -0.71 Year AD
Variability of the EASM over the last millennium Heshang Cave Equation ln(Y) = -0.4115700056 * X - 3.299737702 Residual sum of squares = 2.10758 Regression sum of squares = 2.2533 Coef of determination, R-squared = 0.516708 Residual mean square, sigma-hat-sq'd = 0.0239497 EASMI stalagmite Year AD
4. Reconstructing temperature over the last millennium for China
Comparison between the stalagmite layer thickness chronology (yellow) from Beijing Shihua Cave and the 1000-year tree ring width chronology from Qilian Mountain (green) References: Liu Xiaohong, Qin Dahe, Shao Xuemei et al. Millennial temperature variations recorded in tree ring in the mid-Qilin Mountains. Science in China (Series D), 34, 89-95, 2004. Tan, M., T. Liu, J. Hou, X. Qin, H. Zhang, T. Li, Cyclic rapid warming on centennial-scale revealed by a 2650-year stalagmite record of warm season temperature, Geophysical Research Letters, 30, 1617-1620, 2003. Layer thickness (um) Tree ring index Year AD
1000-year temperature record for China by combining and calibrating the Qilian tree rings and Shihua stalagmite layers (The thick line shows 11-year running mean value) Temperature anomaly (℃) Year AD
1000-year temperature of China derived by combining Qilian tree rings and Shihua Cave stalagmite layers r=0.44, yearly, n=986 r=0.58, 11-year running mean r=0.63, 31-year running mean 1000-year temperature of China simulated derived by ECHO-G model Relationship between the reconstructed (red) and simulated (blue) temperatures of China for the last millennium Temperature anomaly (℃) Temperature anomaly (k) Year AD
Comparison of the EASM and the • temperature over the last millennium
The EASM and the China Temperature is out phase in most periods at decadal and multi-decadal scales SpÖrer Minimum EASMI Temperature anomaly (℃) Thick lines: 11-year running mean Year AD
Moberg NH T Temperature anomaly (ºC) δ18O (PDB‰) Oxygen isotope of stalagmite from Shihua Cave r=-0.35, n=107, p<0.001 Year AD Comparison of oxygen isotope of stalagmite and the NH temperature over the last two millennium This shows that the EASM and the NHT possess similar pattern at millennial or longer scales
Conclusions • The stalagmite oxygen isotopes (SOI) from China mostly consistent with the EASM, which derived from sea level pressure. Thus the SOI can be used to extend the EASMI in some cases. • 2. The EASM and the China Temperature is out phase in most periods at decadal and multi-decadal scales over the last millennium.
Thanks for your attention
Similar patterns on century scale in the isotopes of the stalagmites from Heshang Cave (red) and Shihua Cave (blue)
TS9501 WX42-B 11-year running mean Similar patterns on century-millennium scale in the isotopes of the stalagmites from Wanxiang Cave (blue) and Shihua Cave (red)
Fit 1: Exponential Equation ln(Y) = -0.4115700056 * X - 3.299737702 Alternate Y = exp(-0.4115700056 * X) * 0.03689284304 Number of data points used = 90 Average X = -8.31783 Average ln(Y) = 0.12363 Residual sum of squares = 2.10758 Regression sum of squares = 2.2533 Coef of determination, R-squared = 0.516708 Residual mean square, sigma-hat-sq'd = 0.0239497 Equation Y = -0.3616047515 * X - 1.868588399 Number of data points used = 99 Average X = -8.30502 Average Y = 1.13455 Residual sum of squares = 6.67268 Regression sum of squares = 2.24398 Coef of determination, R-squared = 0.251661 Residual mean square, sigma-hat-sq'd = 0.0687905
Summer monsoon index Year AD
中国南方中世纪缺失温暖期的更长气候记录(与Moberg NHT对比) Moberg NH T δ18O (PDB‰) Temperature anomaly (ºC) 贵州荔波石笋氧同位素 南方在中世纪温暖期与北方不同,意味着什么? Year AD 从小冰期到温暖期的变化幅度已经接近末次冰期中冰阶/间冰阶的变化幅度(H6底到D/O17顶氧同位素差2‰PDB) 文献数据来源:Moberg et al., Nature, 2005; Wang et al., Science, 2005
EASMI PDO of Aug. 9-year running mean
bm (temperature anomaly (℃) BQ (index) Year AD Comparison between the meteorological temperature sequence combining observed Beijing warm-season mean temperature (May to August) and Minle annual mean temperature (bm, dashed line) and the proxy index synthesized with the Beijing stalagmite layers and the Qilian tree rings (BQ, solid line).
SMI PDO-April North China Temperature