Download
1 / 33
330 likes | 334 Views
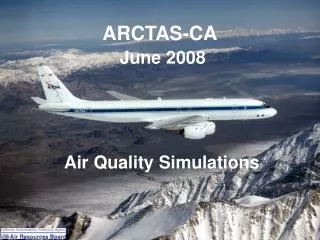
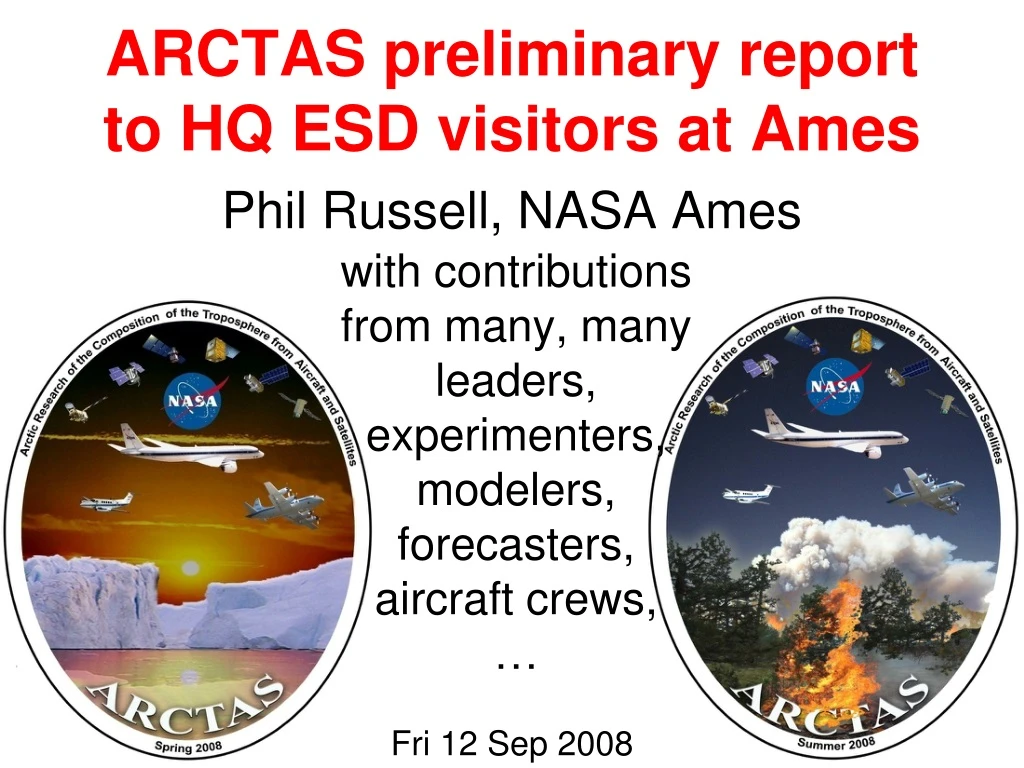
Phil Russell, NASA Ames. ARCTAS preliminary report to HQ ESD visitors at Ames. with contributions from many, many leaders, experimenters, modelers, forecasters, aircraft crews, …. Fri 12 Sep 2008. ARCTAS: Arctic Research of the Composition of the Troposphere

E N D
Phil Russell, NASA Ames ARCTAS preliminary report to HQ ESD visitors at Ames with contributions from many, many leaders, experimenters, modelers, forecasters, aircraft crews, … Fri 12 Sep 2008
ARCTAS: Arctic Research of the Composition of the Troposphere from Aircraft and Satellites Why Study the Arctic Now? Third IPY (2007-2008) • ARCTIC IS UNDERGOING RAPID CHANGE- Rapid warming; receptor of mid-latitudes pollution; boreal forest fires increasing • POTENTIALLY LARGE RESPONSE & UNIQUE CHEMISTRY- Melting of polar ice sheets, decrease of snow albedo from soot, halogen chemistry • UNIQUE OPPORTUNITY- Large NASA satellite fleet; Interagency & international collaboration via POLARCAT & IPY
Arctic Research of the Composition of the Troposphere from Aircraft and Satellites (ARCTAS) A NASA contribution to IPY and the international POLARCAT initiative http://cloud1.arc.nasa.gov/arctas Conducted in spring and summer 2008 with the following foci: 1. Long-range transport of pollution to the Arctic (including arctic haze, tropospheric ozone, and persistent pollutants such as mercury) 2. Boreal forest fires (implications for atmospheric composition and climate) 3. Aerosol radiative forcing (from arctic haze, boreal fires, surface-deposited black carbon, and other perturbations) 4. Chemical processes (with focus on ozone, aerosols, mercury, and halogens) April 2008: Fairbanks and Barrow, Alaska; Thule, Greenland July 2008: Cold Lake, Alberta; Yellowknife, NW Territories NASA DC-8 NASA P-3B NASA B-200 Partners: NASA, NOAA, DOE, NSF, Canada, France, Germany Slide courtesy Jim Crawford, HQ Mgr TCP
Chemistry and Aerosols Radiation, Aerosols, Tracers Aerosol satellite validation 9 Instruments HSRL – CALIPSO RSP – GLORY 21 instruments Satellite Teams: CALIPSO, MODIS, TES, OMI, AIRS, MISR, MOPITT Model Forecasting: GEOS-5, GOCART, STEM, MOZART ARC-IONS: Ozonesonde network in cooperation with Environment Canada The ARCTAS science team includes over 150 scientists and support personnel representing 8 NASA installations, 12 Universities, and 3 Government Labs
Multi-Center Participation on P-3 in ARCTAS AOD, 0Z,7/8 ARC LaRC GSFC AATS COBALT HiGEAR SSFR BBR Aero3X CAR BBR PDS CCN SSFR DFRC: REVEAL MSFC: RTMM
Multi-Center Participation on DC-8 in ARCTAS LaRC: 4 Science Instruments DFRC: REVEAL MSFC: RTMM
DC-8 P-3B B200
ARCTAS-California 2008 OMI NO2 Oct. 22, ‘07 NASA MAIN OBJECTIVES: • Ozone/aerosol formation • Aerosol & radiative forcing • GHGs & precursors • Long-range pollution transport • Satellite validation NASA CAPABILITIES: • Airborne observations • Satellite observations • Global/regional models • Integrated analysis
ARCTAS Field Campaign Strategy: Maximize the value of satellite data for improving models of atmospheric composition and climate Satellites: CALIPSO, OMI, TES, MLS, MODIS, MISR, MOPITT, AIRS • Aerosol optical depth, properties • H2O, CO, ozone, NO2, HCHO, SO2, BrO Calibration and Validation Retrieval development Correlative information Small scale structure and processes Aircraft: DC-8, P-3B, B200 • Comprehensive in situ chemical and aerosol • measurements • Passive remote sensing of atmospheric • state and composition • Active remote sensing of ozone, water vapor • and aerosol optical properties Model error evaluation Data assimilation Diagnostic studies Models: CTMs, GCMs, ESMs • Source-receptor relationships for pollution • Inverse modeling for estimating emissions • Aerosol radiative forcing • Detailed chemical processing
Measurement comparisons were conducted between the NASA DC-8 and partner aircraft as well as between the NASA P3-B and NOAA WP-3D NASA P-3B NSF HIAPER NASA DC-8 NOAA WP-3D DLR FALCON
Example comparison of CO2 measurements onboard the NASA DC-8 (S. Vay, NASA LaRC) and NOAA WP-3D (T. Ryerson, NOAA ESRL) -Blind comparison reveals no detectable difference -Establishing confidence in airborne CO2 measurements is critical to future OCO validation and ASCENDS technology demonstrations.
California and Boreal (Cold Lake) CH4, N2O, CO2 & CO measurements: Highly correlated time series can characterize emissions from varied sources (incl. rice paddies, feed lots, other agriculture, wooded lands, wildfires) DC-8 P-3B B200
ARCTAS P-3 & B-200 Tracks, 26 Jun-12 Jul 2008 AOD, 0Z,7/8 GEOS5 Model prediction of Aerosol Optical Thickness (AOT) Planned P3 Flight Track Flight Plan A
ARCTAS P-3 Data Flight #17, 30 Jun 2008 To measure composition & radiative effects of wildfire smokes in CALIPSO & B200 lidar tracks AOD, 0Z,7/8 GEOS5 Model prediction of Aerosol Optical Thickness (AOT) Planned P3 Flight Track Flight Plan A
ARCTAS P-3 Data Flight #15, 28 Jun 2008 AOD, 0Z,7/8 View from cockpit approaching Lake Athabasca fires • Canadian researchers (Mike Flannigan, Merritt Turetsky, Brian Stocks) • now working on ground to assess impact of fires ARCTAS sampled
ARCTAS P-3 Data Flight #15, 28 Jun 2008 AOD, 0Z,7/8 A closer view from cockpit
AOD, 0Z,7/8 A closer view from cockpit
NRL COAMPS PREDICTED SMOKE FROM ATHABASKA FIRES(courtesy Jeff Reid) 18 Z 9 Jul 2008 GEOS5 - Weak Siberia biomass burning plume between 1-6 km in central Canada, Courtesy Mian Chin - Similar features in some other models. CALIPSO Track Turnaround Point P-3B B200
9 July 2008: B200 and P-3B underfly the CALIPSO track sampling smoke plume from boreal fires in northern Saskatchewan. CALIPSO Track Turnaround Point P-3B B200
P-3 in ARCTAS: Payload Flux↑,↓(l), albedo(l) • AOD • Ext • H2O vapor Flux↑,↓, albedo • Cavity Ringdown ext (2l) • Reciprocal Neph sca (2, RH ) Radiance, BRDF • Nenes CCN • PVM cloud drop reff, vol • TECO O3 COBALT:CO
HSRL/AATS-14 Aerosol Optical Thickness (AOT) Comparison • Comparison of AOT derived from HSRL (B200) and derived from AATS-14 Airborne Sun Photometer (P-3B) while P-3B spiraled up below B200 (AATS14 data courtesy of Jens Redemann) • Large variability in AOT associated with smoke plume Extinction Smoke layer Optical Thickness Preliminary
HSRL/In situ Aerosol Extinction Comparison • Comparison of aerosol extinction derived from HSRL (B200) and in situ dry scattering (neph) + absorption (PSAP) measurements while P-3 spiraled up below B200 (in situ data courtesy of Tony Clarke) Extinction Smoke layer Preliminary
Low level feature due to temporal offset Good agreement in and above the smoke! CALIPSO slightly lower Vertical Feature Mask misidentification Preliminary
MODIS OMI
Typical maneuvers flown by P-3 in ARCTAS To measure aerosols, CO , O3, & radiative effects DC-8 P-3 light cloud
Comparison of AATS, OMI, and MODIS AOD spectra Preliminary J. Redemann, J. Livingston
Comparison of AATS and MODIS AOD spectra Preliminary J. Redemann, J. Livingston
ARCTAS Summary & Future AOD, 0Z,7/8 • NASA’s contribution to IPY & International POLARCAT • Strong intercenter, university, interagency, & international collaboration. • Strong coordination among aircraft, satellites, & models (showed just 1 case of many, many [3 satellites, 2 A/C, several models]). • Ames lead roles in project science, project management, & platform science. Also A/C instruments. • Most analyses just getting started (preliminary data archival due 1 Oct 2008). Potential strong link to ecosystems. • - Highly correlated A/C time series of CH4, N2O, CO2 & CO can characterize emissions from varied sources (e.g., rice paddies, feed lots, other ag, woods, wildfires) • - Canadian researchers (Mike Flannigan, Merritt Turetsky, Brian Stocks) assessing impact of fires ARCTAS sampled • 6. ARCTAS Special Sessions: AGU Fall 2009
AOD, 0Z,7/8 END OF PRESENTATION REMAINING SLIDES ARE BACKUP
Notable N2O and CH4 observations Suggesting Strong SourcesGlenn Diskin and Glen Sachse(communications with Bob Chatfield) "Glenn S. Diskin" <g.s.diskin@larc.nasa.gov> Glen Sachse <g.w.sachse@larc.nasa.gov> 1) California agriculture and wetlands: N2O in the PBL over some valley areas of California reached levels rarely seen by the N2O/CH4/CO team. CH4 also reached high levels, sometimes in concert with N2O , sometimes not. Agriculture/land surface, not pollution: no CO correlation. 2) Boreal observations showed variations of N2O and CH4 within expectations. However extremely high concentrations were noted at and near the airport on takeoff from Cold Lake in one instance. Cold Lake is near the dividing line between cattle pasturage and forest. Unfortunately, no ethane (C2H6) or other hydrocarbon measurements were made which might have distinguished the source. Chatfield will communicate Christopher Potter’s characterization of sources to the Langley team. Possibility: day-by-day estimation of emissions by Potter (responding to irrigation, fertilization, and cropping) may focus on particular source regions and processes.