Download
1 / 32
320 likes | 651 Views
Hurricane Microphysics: Ice vs Water A presenation of papers by Willoughby et al. (1984) and Heymsfield et al. (2005) Derek Ortt April 17, 2007 Background

E N D
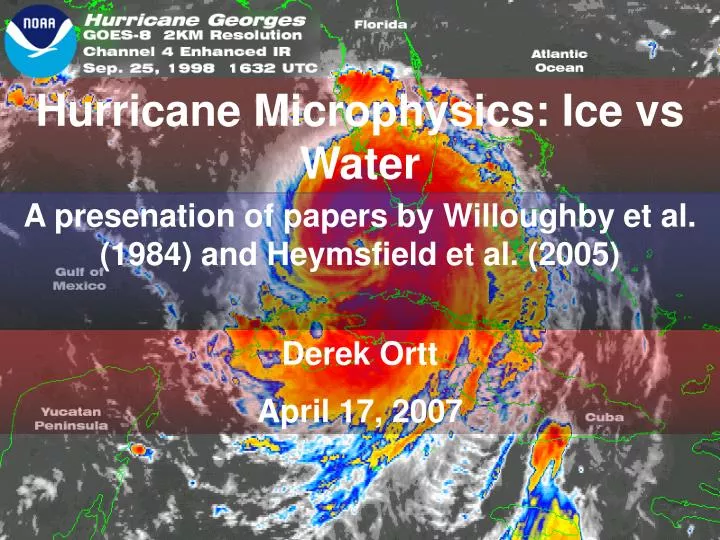
Hurricane Microphysics: Ice vs Water A presenation of papers by Willoughby et al. (1984) and Heymsfield et al. (2005) Derek Ortt April 17, 2007
Background • Previous research on TC structure and intensity has focused on the interaction with the large scale environment (e.g. Gray 1968, DeMaria 1996, Ortt and Chen 2007) or TC internal dynamics (e.g. Schubert et al. 1999 and Kossin et al. 2000) • Recent work has focused on the inetraction of the large scale environment and internal dynamics (e.g. Nong and Emanuel 2003, Lonfat 2004, and Ortt and Chen 2006) • The role of microphysics on internal features has not been well studied (and will be discussed today)
Objectives • To determine theoretically the differences on TC structure of ice vs water • To determine if observed hurricanes match the theoretical model
Model Specifics • Non-hydrostatic and axissymmetric • 2km horizontal resolution for inner 100km, 55km from 100-1500km from center, 1km vertical resolution • Governed by following equations
Time Marching Scheme Computational Grid
Experiments • W5A: Water microphysics, moist troposphere • W5F: Water microphysics, dry troposphere • I7A: Ice Microphysics, moist troposphere
W5A W5F MSLP MAX WIND RMW MEAN RAIN
I7A MSLP MAX WIND RMW MEAN RAIN
WF5 I7A
Summary • The use of ice microphysics produces structures similar to observed TCs • Convective rings in the ice microphysical simulations produce structures and inward propagation similar to observed TCs • Downdrafts are caused by melting of ice • Water microphysics produce fewer convective rings and faster inward propagation of secondary eyewalls • Not all convective rings produce a secondary wind maximum • Do observed TCs have characteristics similar to these model results?
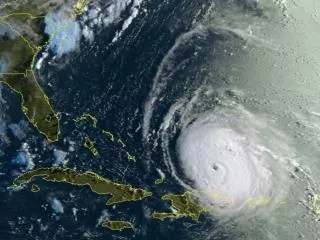
Data and Method • In situ observations from Hurricane Humberto, part of CAMEX (see Jan, 2006 JAS) • Particle Size distribution (PSD) probes with 25 and 100 micrometer resolution • FSSP probe that records data from 3 to 45 micrometers • Cloud particle imager • DC-8 Doppler Radar with 60m vertical resolution • Gamma and exponential functions fitted to the data • Only fitted distributions with r2 > .8 used • Vertical motions determined by subtracting vertical motions of the DC-8 from the data
Imaging Probe Particle Size Distributions FSSP Particle Size Distributions
IWC Slope of Fitted Exponential Distributions
Frozen Rain
Summary • Hurricane Humberto had high concentrations of ice particles • Supercooled water droplets were confined to the strong updraft regions • These updrafts match the results of Willoughby et al. in the numerical model simulations