Download
1 / 42
420 likes | 751 Views
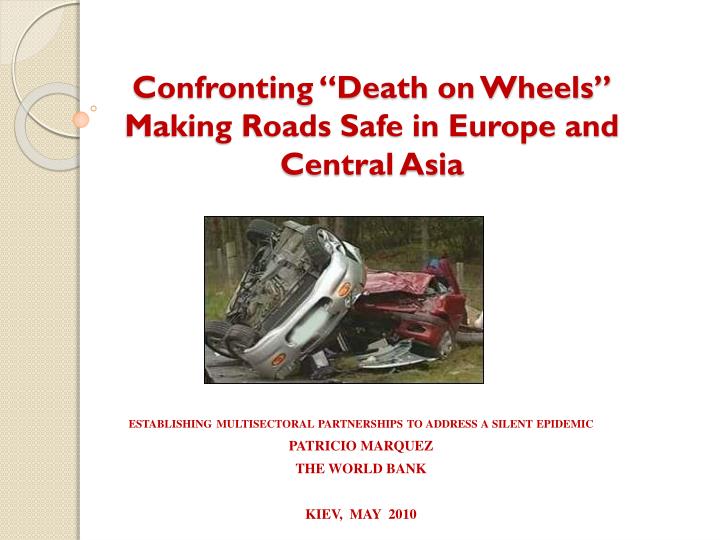
Confronting “Death on Wheels” Making Roads Safe in Europe and Central Asia . establishing multisectoral partnerships to address a silent epidemic PATRICIO MARQUEZ THE WORLD BANK KIEV, MAY 2010. Outline: Challenges and Opportunities in Addressing Road Safety in the ECA Region*.

E N D
Confronting “Death on Wheels”Making Roads Safe in Europe and Central Asia establishing multisectoral partnerships to address a silent epidemic PATRICIO MARQUEZ THE WORLD BANK KIEV, MAY 2010
Outline: Challenges and Opportunities in Addressing Road Safety in the ECA Region* • The problem: trends, size, characteristics, causes • Effective measures to improve road safety • Current international road safety policy • Possible strategies and actions by the World Bank with partners *Baltic, Balkans, EE, CIS, Turkey.
30 25 20 European Region EU CIS 15 10 5 1980 1990 2000 2010 Road Traffic Injury (RTI) Mortality Rate Trends Europe, EU-27 and CIS Countries, per 100,000, 1980–2007large, increasing disparities CIS countries: Azerbaijan, Belarus, Georgia, Kazakhstan, Kyrgyzstan, the Republic of Moldova, Russia, Tajikistan, Turkmenistan, Ukraine, and Uzbekistan. EU-27 countries: Austria, Belgium, Bulgaria, Cyprus, the Czech Republic, Denmark, Estonia, Finland, France, Germany, Greece, Hungary, Ireland, Italy, Latvia, Lithuania, Luxembourg, Malta, the Netherlands, Poland, Portugal, Romania, Slovakia, Slovenia, Spain, Sweden, and the United Kingdom. Source:WHO EURO Health for All Data Base (2009). CIS European Region EU-27
Kazakhstan 30.6 Russian Federation 25.2 Kyrgyzstan 22.8 Lithuania 22.4 Ukraine 21.5 Montenegro 20.4 Turkmenistan 18.6 Latvia 17.9 Georgia 16.8 Belarus 15.7 High-incomecountries Slovakia 15.1 Republic of Moldova 15.1 Low- and middle-income countries Greece 14.9 Estonia 14.7 Poland 14.7 Slovenia 14.6 Tajikistan 14.1 Albania 13.9 Armenia 13.9 Croatia 13.6 Turkey 13.4 WHO EURO 13.4 Bulgaria 13.2 Azerbaijan 13.0 Romania 12.7 Hungary 12.3 Czech Republic 12.0 Bosnia and Herzegovina 10.9 Portugal 10.4 Cyprus 10.4 Belgium 10.2 Iceland 10.0 Serbia 9.8 Uzbekistan 9.7 Italy 9.6 Spain 9.3 Ireland 8.5 Austria 8.3 France 7.5 Finland 7.2 MKD* 6.9 Germany 6.0 Israel 5.7 United Kingdom 5.4 Sweden 5.2 Norway 5.0 Switzerland 4.9 Netherlands 4.8 Malta 3.4 San Marino 3.2 15 0.0 5 10 20 25.0 30.0 35.0 Deaths per 100 000 population RTI Death Rates in WHO-EURO Member Countriesper 100,000 Population, 2007 Kazakhstan Russian Federation Kyrgyzstan Ukraine Montenegro Turkmenistan Latvia Georgia Belarus Slovakia Rep. of Moldova Greece Estonia Poland Slovenia Tajikistan Albania Armenia Croatia Turkey Average-WHO-EURO Bulgaria Azerbaijan Romania Hungary Czech Republic Bosnia & Herzegovina Portugal Cyprus Belgium Iceland Serbia Uzbekistan Italy Spain Ireland Austria France Finland Fmr Yugoslav Rep. of Macedonia Germany Israel UK Sweden Norway Switzerland Netherlands Malta San Marino Source: WHO-EURO, 2009 30 25
Economic development does not lead automatically to lower road fatalities, therefore need for effective road safety management strategy
The RTI situation in Ukraine (1) • Road traffic crashes decrease from 63,000 in 2007 to 51,000 in 2008. • Similarly, RTI fatalities were reduced from about 9,600 to 7,700 over this period. • About 40,000 people suffered nonfatal car injuries in 2007. • But, while these figures represent a drop of about 19% from 2007 to 2008, road safety in Ukraine still lags far behind than in Western European countries: that have a RTI mortality rate of less than 5 per 100,000 as compared to 16.5 in Ukraine in 2008. • This is a key challenge given the upcoming European Football Cup to be held in Ukraine and Poland in June 2012.
The factors driving the RTI epidemic • The growth of road traffic injuries depends on the rate of growth of motorization and the rate of change in fatalities per vehicle (Kopits and Cropper 2005). • Since the 1990s, the number of passenger cars per 1,000 population in the CIS countries, including Ukraine, increased by more than 120%. • In many transition countries of Eastern Europe and Central Asia, the rate of vehicle ownership grew faster than the decline in the rate of fatalities per vehicle, while policy and governance did not keep pace with the booming motorization.
Deaths, disability and damage – who bears the brunt? 4-wheel vehicle occupants: 40-75% of RTI deaths in ECA Young adults, especially men: 55% of road traffic deaths in ECA countries are people aged 15–44, mostly 15–29; > 80% of deaths are men Cyclists, motorcyclists at high risk (but small % of total) Motorcyclists, pedestrians at 7-9 times greater risk of death if in an road crash than people in vehicles Pedestrians – more likely to be children or elderly, and people with lower incomes In Albania, Belarus, Kyrgyzstan, Tajikistan, and Ukraine, pedestrians are ≥ 40% of all road fatalities, 31-38% in all ECA
The situation in Ukraine (i) • About 70% of all car crashes occur in cities and 30% in highways—majority in international highways. • Kiev and other regional urban centers together contribute to more than 30% of the country’s car crashes. • Pedestrians account for more than 40% of road traffic fatalities as compared to 18% in the EU countries. • The high percentage of pedestrian deaths, in sharp contrast with other European countries, is evidence of the Ukrainian transport system‘s limited ability to cope with rising traffic and the needs of vulnerable road users.
Deaths, disability and damage – extent • 80,000 road traffic deaths, 820,000 injuries in ECA in 2007 (Data underestimate and underreport – especially non-fatal injuries, and differ in availability, quality, and completeness) • Economic Impact: 1-2% of GDP (health care & rehabilitation costs, insurance, legal, lost productivity, property damage) Globally, costs to governments > US$500 billion annually Highest costs in ECA: large economies with big populations: • Air pollution, noise. • Greenhouse gas emissions contribute to global warming • Fear deters walking, biking. Less mobility and physical activity reduces health, increases risks for cardiovascular diseases, strokes, diabetes, obesity Russia (US$34 billion per year, 33,308 deaths in 2007) Turkey (US$14 billion) Poland (US$10 billion) Ukraine (US$5 billion)
Impact on the Health System • RTIs impose a high total on health systems everywhere. • Estimates for Russia indicate that road traffic victims are seven times more likely to need hospitalization compared with victims of other types of trauma. And road traffic injuries account for 75 percent of all types of injury, with victims of road traffic crashes representing more than 60 percent of severe trauma cases. • The provision of medical services for traffic injuries and other external causes absorbed about 0.27 percent of GDP in 2003, or about USD 1.2 billion (World Bank 2005).
Road Traffic Injury Causes • Lack of data /problem awareness • Inadequate response, resources Roads • Bad road design (no crossings, walkways, poor visibility) • Roadside hazards (trees, poles, signs) • Mixing traffic and pedestrians Vehicles • Unsafe vehicles, without airbags & other crash protection devices • Huge increase in vehicle numbers (poor public transport) Behaviors • Inadequate laws/rules + poor enforcement • Bad driving (speeding, recklessness, alcohol, some medications) • Not using seatbelts, helmets (cyclists, motorbikes) • Mobile phone texting • “Are you in a hurry to reach us?"
The situation in Ukraine (ii) • Several factors contribute to road traffic injuries. About 60% of car crashes in Ukraine are caused by speeding vehicles and poor driving behavior. • Drunk driving, accounting for 5% of all road crashes, is another risk factor, and young drivers and riders aged 18–25 are particularly at risk. • Other risk factors are poor road conditions and pedestrian behavior. • Also looming is distracted driving while using cell phones and sending text messages.
WHAT TO DO? • INTERVENTIONS ALONE WILL NOT SUFFICE
Current Road Safety Policy – Holistic “Safe Systems” approach • Principles: • Cannot prevent all road crashes, can reduce traffic injuries • Design road traffic systems to take account of human error and vulnerability of human body • Responsibility and accountability for road safety shared by road and car designers and road users
Effective Approaches Action Areas: • Prevent road traffic crashes and injury • Minimize injuries when crashes occur • Recovery: reduce injury severity afterwards The Haddon Matrix: a holistic framework for intervention focusing on road transport and its risks • Car crashes divided into 3 phases: before, during and after to highlight when crashes can be prevented or their effects minimized
Adopting a Road Safety Management System Source: Bliss and Breen, building on the frameworks of Land Transport Safety Authority, 2000; Wegman, 2001; Koornstra et al, 2002; Bliss, 2004
Institutional management functions • Delivered by government entities, in partnership with civil society and business entities to achieve RESULTS
RESULT FOCUS • A foremost and pivotal institutional management function • It is a programmatic specification of targets and means to achieve them with accountability • Provides cohesion and direction, strategic orientation linking interventions with results, analyzes what could be achieved over time • Sets a performance management framework for delivery of interventions and their intermediate and final outcomes
FUNCTIONS (i) • Coordination: horizontally and vertically, partnerships • Legislation: the legal instruments for governance; defines responsibilities, accountabilities, interventions, and related institutional management functions
FUNCTIONS (ii) • Funding and resource allocation: how to finance interventions and related management functions on a sustainable basis • Different mechanismsadopted in various countries
Funding Sources Traditional funding sources: • General tax revenues • Road funds (fuel taxes, vehicle registration and licensing fees, and heavy vehicle road use charges) • Road user fees (driver’s and car license fees, vehicle inspection fees) • Vehicle insurance premium levies • Earmarked charges (eg revenue from traffic fines used to finance road safety activities) Alternative financing sources: • Price/tax policy (fiscal incentives for private and business investments in safety measures such as retrofitting older vehicles with safety belts) • Insurance premiums (higher premiums for less safe vehicles, and drivers with poor safety records; pay-as-you-drive or pay-as-you-speed mechanisms, spread costs of risks for injury-causing crashes more fairly; assign total cost of car crashes to the person who caused it) • Financial options (make unsafe behavior more expensive and give financial reward for safe behavior) Source:Adapted fromOECD (2002) and Aeron-Thomas and others (2002), cited in Peden and others (2004); ECORYS (2006).
FUNCTIONS (iii) • Promotion:sustained communication of road safety as core business for government and society to support interventions • Monitoring and evaluation: the systematic and ongoing measurement of outputs and outcomes, and impact evaluation—did results were achieved? Need for registries for vehicles and drivers, crash databases, and survey work
FUNCTIONS (iv) • Research and Development and Knowledge Transfer: the systematic and ongoing creation, codification, transfer and application of knowledge that contributes to improved efficiency and effectiveness of road management system. • Knowledge transfer must be evidence-based and grounded in practice by a learning by doing process.
Classification of Interventions Source: Bliss, 2004
Effective proven measures Better road design • Remove roadside hazards (trees, poles) • Install crash barriers • Clear, helpful, safely placed road signs • Central islands, “pedestrian refuge” • Well-designed pedestrian crossings • Separate vehicles from pedestrians and cyclists • Audible road edge-lining, seal shoulders, construct passing lanes • Better road markings • Traffic calming (speed bumps, cameras)
Effective proven measures (2) Improve vehicle safety • In-vehicle crash protection (airbags, seatbelts, child car seats) • Vehicle licensing and inspection to enforce roadworthy standards • Daytime running lights • Require and enforce helmet use with bicycles, motorbikes
Effective proven measures (3) Behavior change - education, law/regulation enforcement • Lower speed limits: 30 km/hr in residential areas, 50 km/hr in other urban areas • Enforcing blood alcohol level limit of ≤0.05g/dl could prevent 5-40% of RTI deaths (random breath testing better than set checkpoints, taxes and marketing, sales regulations are effective) • Mandatory, enforced seat belt use • Prevention of distracting driving due to use of phones and texting • Media coverage, education campaigns + tough sanctions • Graduated driving licenses (curfew, passenger restrictions) and more training during learner period reduce deaths among young drivers (US) • Better public transport and land use reduces car travel
Health Sector Response • Public health actions: collect and analyze data, research causes of RTI, advocate effective action, define and implement protective policies and practices and preventive interventions • Primary health care providers: medical assessments of elderly/impaired drivers, advice on alcohol use and effects on driving of medications • Emergency medical services: communication for rapid response, initial emergency care and stabilization, transport to health facility, well-trained teams with medicines and equipment, quality assurance • Safe blood supply &transfusion • Rehabilitation services
Cost-effectiveness – depends on risk factors, and distribution of fatalities/injuries by road user group Average cost per disability-adjusted life (DALY) year saved, adjusted for purchasing power parity
Safety Target Source: Bliss, 2004
ECA Efforts to Prevent Road Transport Injuries in Ukraine • The State Car Inspectorate at the Ministry of Internal Affairs is responsible for road safety: from supervision of traffic by traffic police, car inspection and registration, issuance of driver licenses, control of conditions and operation of road network to data collection and reporting of RT crashes. • Effective multisectoral collaboration to implement national program with a results orientation yet to be developed: a key institutional development challenge. • Governance issues, particularly improvement in the enforcing of laws and regulations (traffic supervision), and the introduction and scaled up use of mobile devices (e.g., speed cameras) represent another challenge.
What could be done in the health sector in Ukraine to reduce RTIs? • Intensify prevention efforts through information, education and communication to modify risky behaviors among drivers and pedestrians alike. • Restructure the emergency medical services as part of health system reform efforts to prevent unnecessary fatalities and lasting disabilities due to RTIs: • Reorganization and improvement of pre-hospital services: centralized ambulance dispatcher centers, improved ambulance and communication systems, including use of GPS, training of paramedics. • Reorganization/strengthening of trauma centers on the basis of level of complexity along the highways and creation of “centers of excellence” for addressing complex injuries.
What could the World Bank do? (i) • Practical guidelines to help countries implement these recommendations • Global Road Safety Facility generates funding and Technical Assistance for country road safety efforts • Road safety management capacity reviews done in many ECA countries • World Bank-supported road safety investments in transport and health projects • Information and policy dialogue • In Ukraine, it is already financing a project to improve the roads network.
What could the World Bank do? (ii) 2004 World Report identifies 6 key steps for success: • Identify a lead agency in government • Assessroad traffic injury problems, policies and institutions, and capacity for prevention • Prepare a national road safety strategy and plan of action • Allocate financial and human resources • Implement specific actions and evaluate their impact • Support national capacity and international cooperation. Principles: systematic, sustained, successful effort has 3 parts: Results Institutional management interventions
What could the World Bank do? (iii) • Build institutional management capacity • Provide training and information for policy makers, practitioners • Support existing networks of people responsible for road safety • Help countries improve data on RTIs and causes • Specify lead agency reforms needed • Help countries choose interventions well • Review national road safety management capacity - assess the situation, propose strategies and actions with realistic targets and budgets • Support a safe system approach + results focus aiming to end road deaths and serious injuries (see next slide for specifics)
What could the World Bank do? (iv) • Support a safe system approach + results focus aiming to end road deaths and serious injuries: • Analyze planned road investments for safety, improve design • Review road sections where many crashes occur to target investments • Lower urban speed limits to 50 km/h; 30 km/h in residential areas; enforce – speed cameras are cost effective • Enforce alcohol limits with systematic police enforcement (breath tests, high-visibility random road checks), high-profile media campaigns, and swift severe penalties • Enforce use of seat belts – campaigns, penalties, car restraint specifications • Reduce young driver risk– graduated licensing scheme, extended training • Reduce pedestrian risk – barriers, traffic “calming”, more pedestrian facilities • Improve speed and quality of emergency care (at crash site and after) – evaluate, identify and fix weak areas, train • Include road safety as a key “performance attribute” of transport • Demonstration projects, with strong evaluation
Focus areas for World Bank support that is evidence-based, cost-effective, and follows international best practice: • Capacity reviews – to ensure country commitment, customization, consensus • Ensure lead agency has capacity, mandate, and funding to manage for results • Invest in management capacity to deliver results in stages • Learn by doing demonstration projects that rapidly achieve safety improvements in high-risk areas, then build on success Key Partners: • Global Road Safety Partnership of the International Red Cross Federation • International Road Assessment Program (iRAP) - engineering safety • RoadPOL - traffic police peer-to-peer services • International Road Traffic Accident Database Group - data • World Health Organization (WHO) - technical support in traffic injury prevention, injury surveillance, emergency trauma services & care • Ministries: transport, health, law enforcement, finance, interior, education • Private sector: insurance, auto makers, media, regulatory agencies • CSOs: consumer organizations, faith-based organizations • Parliaments
Take Away Messages: • Safe, clean, affordable transport is a development priority. • Preventing road traffic injuries is a major public health priority. • Proven, effective, cost-effective “good practices” can save lives and money, prevent disability, improve other health outcomes and the environment. • A “safe system” needs well-coordinated, cooperative action by transport, health and policing/enforcement sectors. Interventions alone will not suffice. • The World Bank could do more, with partners, to help countries in Eastern Europe and Central Asia make roads safer. Specific areas for action are clear. Thank you!