Download
1 / 13
130 likes | 387 Views
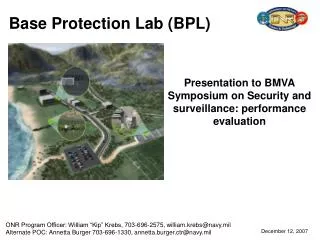
Presentation to BMVA Symposium on Security and surveillance: performance evaluation. Base Protection Lab (BPL). December 12, 2007. ONR Program Officer: William “Kip” Krebs, 703-696-2575, william.krebs@navy.mil Alternate POC: Annetta Burger 703-696-1330, annetta.burger.ctr@navy.mil.

E N D
Presentation to BMVA Symposium on Security and surveillance: performance evaluation Base Protection Lab (BPL) December 12, 2007 ONR Program Officer: William “Kip” Krebs, 703-696-2575, william.krebs@navy.mil Alternate POC: Annetta Burger 703-696-1330, annetta.burger.ctr@navy.mil
Objectives • Conduct basic research to provide more open public access to recreational and other non-restricted facilities on military bases and to improve the overall base safety and security utilizing advanced video and signal based surveillance. • Create test bed in Hawaii to evaluate whether novel sensors (video cameras, radio frequency identification, seismic, LIDAR, microwave, and infrared sensors) in combination with behavior analysis software can identify patterns of behavior.
PMRF BPL System Diagram PMRF Base Protection Laboratory (PBPL) Data Collection (Integrated Sensor Systems) RFID MW / IR Lidar Seismic Video Textual Others Base Security AlertDelivery & Situation Data Sensor Data Links (Wireless) Internet Development Platform Firewall External (Wide Area) Network Sensor Data Processing Remote Users and Developers: – SAIC Kauai – SAIC Maui – SAIC Arlington– UH Manoa– Novasol Oahu–Object Video– MHPCC Maui– Others Behavioral Analysis - Automated Behavior Analysis (ABA)- Statistical Anomaly Detection (SAD)- Agent Based Modeling (ABM) Data Storage & Archiving Data Fusion & Tracking Alert Generation Middleware Simulation & Playback Production System – Data Analysis and Management
Current BPL Sensor Configuration22°00’51.66”N 159°46’56.28”W • Outdoor Test Bed • 4.5km by 1km area • Linked by wireless communications • Open Architecture • Hardware Configuration • Mobile sensors enable optimum sensor coverage for data collection exercises • Software Configuration – modular, flexible and reusable • Object-oriented software • Based on Java Jini architecture • Communication through a “blackboard”
Sensors RFID System – UltraWideBand 2 LIDAR motion trackers 5 License Plate Readers 8 Low Light Cameras 4 Video Cameras Seismic Array (2000 feet) 2 MW/IR Fence Posts (500 feet fence)
Data Collection • Data Collection • Scripted Scenarios for Abnormal Activity • 4 Days data of confederates • Normal Data • 2 Days data of base personnel and recreational visitors • Sensor Collection Results • 12 video cameras with advanced video analytics software • detected and tracked objects of interest without problems • LIDAR – converted for intrusion detection and alarm sensor • Detected and provided accurate alerts • Microwave and Infrared Detection Fences • 100% detection and 0% false alarms for motion detection • RFID • Limited coverage to be improved with tuning antennas and replacing fixed sensors with mobile units • Seismic • No data available due to compatibility issues • Sensors should be available Jan08
Proposed RFID Coverage 2D coverage (coordinates) Seen by three or more receivers Provides (x, y) with 3m or better accuracy 1D coverage (a point between two sensors) Seen by two receivers Provides a point (xΣ,yΣ) on a line between the two sensors. 0D coverage (presence in an area) Seen by one receiver Provides the coordinates of the sensor (xS ,yS) that sees the entity No detection (no information) Seen by none of the receivers
LIDAR Sensor 1000 feet
LIDAR Tracks map overlay System Administrator Display - pedestrian and vehicle traffic
Challenges • Develop a reliable, plug-play, robust test bed to meet researcher requirements. • Develop common standard data sets that vary in difficulty that can be used to assess algorithm performance. • Develop valid and reliable metrics to evaluate and compare behavioral algorithm performance.
Future Plans • Create common data sets and metrics. • Distribute data sets to research community to test whether behavioral algorithms can detect “normal” and “anomalous” behavior for the prediction of threats and advance warning using a variety of sensors. • Test and evaluate sensor options to optimize early detection of threat behavior and reduce security manpower requirements.