Download
1 / 21
210 likes | 346 Views
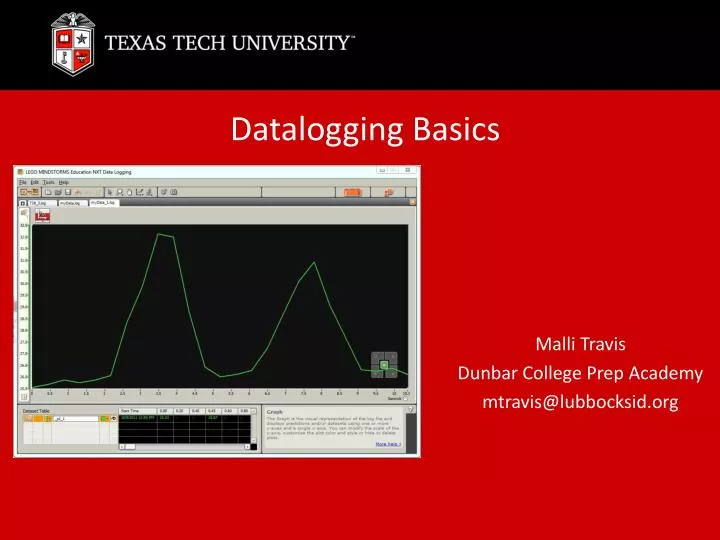
Datalogging Basics. Malli Travis Dunbar College Prep Academy mtravis@lubbocksid.org. Why use datalogging in class?. Hands on aspect enables students to watch in real time the results of any experiment they perform

E N D
Datalogging Basics Malli Travis Dunbar College Prep Academy mtravis@lubbocksid.org
Why use datalogging in class? • Hands on aspect enables students to watch in real time the results of any experiment they perform • Advances in technology allow students to spend less time plotting data and more time on critical thinking skills (21st Century Skills…hmmm?) • Open ended nature of experiments promote scientific inquiry
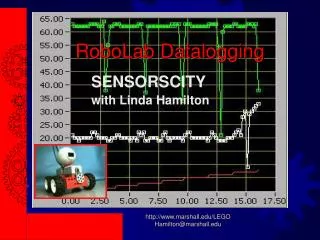
What is datalogging? The process of collecting information for later analysis Environmental
Vocabulary • Data sets • Collection of data that has been recorded by a particular sensor
Vocabulary • Resolution • High frequency • Low frequency
Vocabulary • Sampling frequency
Vocabulary • outliers
Vocabulary • Data influence
Additional Terms • Maximum/minimum values • Trend • Slope • Axis (horizontal and vertical) • Scale
NXT Parameters • 4 separate sensors (light, touch, sound, ultrasonic) • 3 built in rotation sensors • Optional for use with book – temperature • Battery life • Data memory
http://shop.lego.com/en-US/ NXT IR Receiver $49.99 Compass $54.99 Gyroscopic $54.99 Infrared Seeker $49.99 Accelerometer $54.99 Accelerometer $54.99
To open NXT-G software • Open shortcut icon from desktop • If already in main NXT-G program use the switch toggle underneath “File” • Robot educator activities are excellent resources for tutorials and extra activities
Configuration Panel Name your experiment and then you’ll be directed to the configuration panel. • Set duration – remember battery level • Also consider experiment itself (clapping hands) • Rate – time between samplings • Maximum is 25 times per second • Configure sensors • Options for each sensor will appear between port and colored box • Colored box drives color of line on screen – can be changed
Operation • Real Time Operation • Maintains connection between computer and NXT throughout the length of the experiment • As values change, graph will also change in real time to reflect changes • To enable, press “download and run” button in control panel • When experiment duration is over, press button again to run experiment again
Operation • Remote Operation • NXT can be disconnected and moved to another location for actual experiment • Press “download” button (similar to movement programs) • Run from my files as any other program • Connect back to computer, press upload, choose data log file from screen to retrieve data
Analysis of Data Tools • Zoom – closer view on particular portions • Prediction – write and erase prediction lines • Analysis – choose single points or range of values • Annotate – enables small notes • Screenshot – takes a picture of graph and saves as standard image file to use in other programs