Download
1 / 39
390 likes | 490 Views
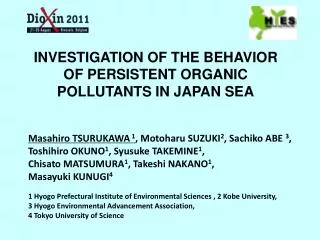
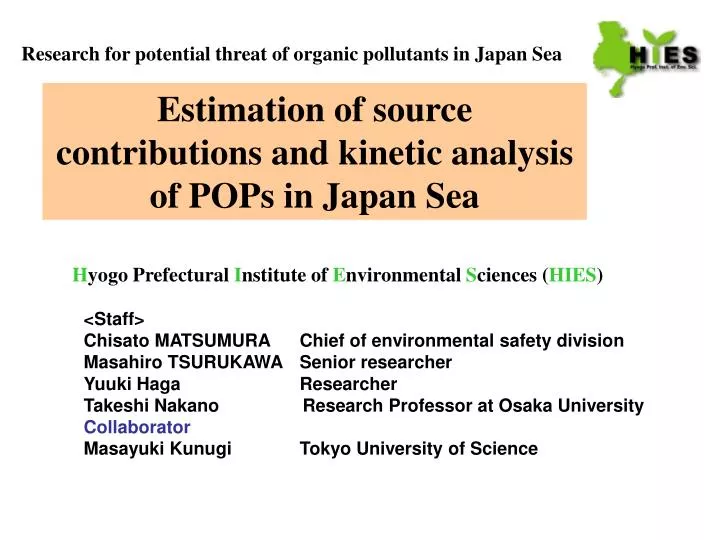
Research for potential threat of organic pollutants in Japan Sea. Estimation of source contributions and kinetic analysis of POPs in Japan Sea. H yogo Prefectural I nstitute of E nvironmental S ciences ( HIES ). <Staff> Chisato MATSUMURA Chief of environmental safety division

E N D
Research for potential threat of organic pollutants in Japan Sea Estimation of source contributions and kinetic analysis of POPs in Japan Sea Hyogo Prefectural Institute of Environmental Sciences (HIES) <Staff> Chisato MATSUMURA Chief of environmental safety division Masahiro TSURUKAWA Senior researcher Yuuki Haga Researcher Takeshi Nakano Research Professor at Osaka University Collaborator Masayuki Kunugi Tokyo University of Science
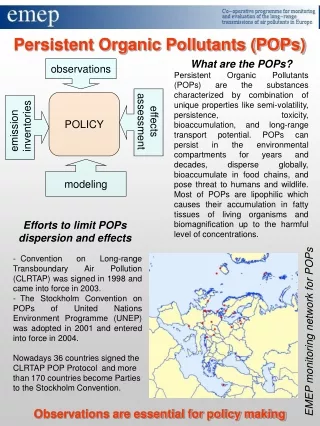
Japan Background Global Technical HCH usage (Yi-Fan Li etc)
Background POPs usage in Japan and China
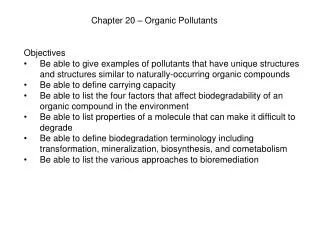
POPs in the oceans Objective and means Estimation of source contributions and kinetic analysis of POPs in Japan Sea 1. POPs concentration 2. Isomer fingerprints of POPs 3. Enantiomer ratio of POPs Sea water
Target Ocean Area Okhotsk Sea Japan Sea The Pacific East China Sea
H C l C l H C l C l H H H H C l C l C l H H C l H H C l C l H C l C l H Target POPs (-) (+) TargetChiral Compound α-HCH
18 18 19 19 17 17 16 16 Sampling point No.1~No.19 15 15 14 14 13 13 12 12 11 11 10 10 9 9 2 2 2 2 3 3 3 3 2 2 8 8 1 1 7 7 3 3 6 6 1 1 1 1 4 4 5 5 Air sampling 1 Sampling Point 2009’sSurvey (2009.9~10)
Sampling Point 2010.7~8 2010.9~10 Chang Jiang 2010.8 2010’sSurvey
Ocean current in the sea around Japan 2011.10.15 2011.10.16 Sampling Point 2011.10.14 2011.10.20 2011.10.21 2011.10.13 start 2011’sSurvey 2011.10.24 (2011.10)
Water sampling 50L (0.5 L/min) GC-50H Sea water sampling Air sampling PUF+ACF×3 GB-100R+PUF+ACF×3 108 m3(300 L/min,6hr) Sampling Method Voluntary ship:ASKA-Ⅱ
Analytical method Dissolved organic compound Particulate component QMF PUF+ACF +Surrogate ASE extraction (Acetone and DCM) Concentration Hexane extration Dehydration and concentration LC-Silica clean up Concentration to 100μL SYS HRGC/HRMS (JEOL JMS-800D) Surrogate; 13C-POPs (2500pg) SYS ; 13C-PeCB#101(500pg)
RESULT ⅠConcentrationdistribution ⅡIsomer pattern
Ratio of Dissolved and SS component ⇒Most of POPs exist in dissolved phase
Concentration level(HCH) (reference :river in Japan) MOE 2009’s POPs Monitoring (pg/L) rangeaverage α-HCH14~560 74 γ-HCH5.1~280 32 β-HCH 18~1,100 150 2010 and 2011’s survey include the seas around Hokkaido , and higher than 2009’s result.
Concentration level(other POPs) (reference :river in Japan) MOE 2009’s POPs Monitoring rangeaverage o,p’-DDD0.44~414.4 p,p’-DDD 1.4~14014 o,p’-DDT0.43~1002.4 p,p’-DDT 0.81~440 9.2 HCB 2.4~180 15 t-chlordane3.0~690 23 c-chlordane 4.4~710 29 t-nonachlor2.7~530 20 c-nonachlor 1.4~210 7.1
Ave. 2300 Concentration distribution of HCHs 2011’s survey 2010’s survey
2011’s survey(α/β-HCH ratio) β-HCH vapor pressure is lower and boiling point is higher than other isomers.
2011’s survey(α/γ-HCH ratio) Technical-HCH α/γ=4.3~5.0 Sea around Hokkaido fresh pollution? or transferred from north polar reigion Chang Jiang
Ocean Circulation in Okhotsk Sea http://www.lowtem.hokudai.ac.jp/joint/okh/movie.html 10月に投下された粒子は、晩秋より強くなる東樺太海流に乗って3ヶ月足らずで北海道沿岸まで到達する。 参考文献: Ohshima and Simizu (2008, J. Oceanogr.), Uchimoto et al.(2007, J. Oceanogr.)
DDT in sea water concentration(pg/L) (reference :river in Japan) MOE 2009’s POPs Monitoring rangeaverage o,p’-DDT0.43~1002.4 p,p’-DDT 0.81~440 9.2 2009’survey 2011’survey
2011’s survey range average median t-chlordane 11~54 23 21 c-chlordane 4~19 10 10 (reference :river in Japan) MOE 2009’s POPs Monitoring rangeaverage t-chlordane3.0~690 23 c-chlordane 4.4~710 29 Chlordane in sea water concentration(pg/L)
2011’s survey range average median t-nonachlor 4~2011 10 c-nonachlor 0~11 4 10 (reference :river in Japan) MOE 2009’s POPs Monitoring rangeaverage t-nonachlor2.7~530 20 c-nonachlor 1.4~210 7.1 Nonachlor in sea water concentration(pg/L)
HCH in Air concentration (pg/m3) range average median α-HCH 12~18 15 17 γ-HCH 6~11 8.6 10 β-HCH1.2~21.5 1.4 (reference :ambient air in Japan) MOE 2009’s POPs Monitoring rangeaverage α-HCH7.8~400 21 γ -HCH 1.5~55 5.6 β-HCH 0.31~24 1.8 (cold season)
Lindane (99% γ-HCH) Technical HCHs (60-70% α-HCH) Korea Chicago Japan HCHs air concentration γ α Guangzhou Hong Kong 100pg/m3 Estimation of POPs resource by comparing with POPs isomer fingerprints POPs in the oceans
C l C l C l C l C l C l C l C l C l C l C l C l C l C l C l C l H C l C l H C l C l C l C l H H C l C l C l C l H H C l C l C l H H C l H H C * C * C l C l H C l C l H H H C l C l C l C l Enantiomer of POPs Some POPs are chiral and present as racemates in the technical product. o.p’-DDT trans-chlordane alpha-HCH
Enantiomer Fraction (EF) non-racemic residues racemates metabolism (+) (-) technical products (+) (-) (-) (+) EF > 0.5 EF < 0.5 EF = 0.5 E(+) E(+) : (+) enantiomer peak area EF = -------------- E(+)+ E(-) E(-) : (-) enantiomer peak area The EF variation may distinguish POPs transfer of current use and that of past applications.
E(+) EF = ---------- E(+)+ E(-) H C l C l H C l C l H H H H C l C l C l H H C l H H C l C l H C l C l H The chromatograms of alpha-HCH enantiomers Standard solution (-)α (+)α γ β EF=0.5 The sea water in Japan Sea P19-JⅡ Preferential degradation of (+) in seawater (+)α (-)α EF=0.42 alpha-HCH
Southwest Sakhalin Downstream site of Chang Jiang 2011’s survey(EF value of α-HCH) No.18 Previous survey(~2010) Chang Jiang and the sea around Hokkaido ⇒near racemic
Jiangsu of Chinese province in 2009 October Dechlorane Plus(DP) C18H12Cl12 Profile of DP Isomers fsyn=syn-isomer/total DP Technical DP fsyn=0.40±0.01(Anpon) fsyn=0.20-0.36(OxyChem)
Dechlorane Plus range0.7~14 average 2.7 median 1.6 (reference) air12~7,737pg/m3 soil5.11~13,400ng/g-dry (De-GAO WANG, Environ.Sci.Technol,2010,44,6608-6613) river water0.2-2ng/L(Songhua river,Harbin) (EdSverko,Environ.Sci.Technol,2011, 45,5088-5098) Dechlorane Plus in seawater concentration(pg/L)
Dechlorane Plus range0.7~3 average 1.4 median 1.3 1.5 Dechlorane Plus in Air concentration(pg/m3)
range 0~0.4 2011’s Survey Dechlorane Plus in seawater fsyn ratio(-)
Conclusion Ⅰ. POPs concentration distribution was investigated. HCH concentration inthe sea around Hokkaido and HCH, DDT,Chlordanes concentration in the area of Tsushima Straits is higher than other areas. Ⅱ. From a point of view of isomer analysis(α/γ ratio), Linden(γ-HCH) usage in China may influence the circumstances in Japan sea. Ⅲ. Using enantiomer analysis, it was clarified that α-HCH -EF value tend to decrease with latitude.
気象庁 日本近海 日別海流 http://www.data.kishou.go.jp/kaiyou/db/kaikyo/daily/current_jp.html
trans-Chlordane/cis-Chlordane ratio Tsushima Straits
Chlorpyrifos in sea water concentration(pg/L) Data range 5~325pg/L Average 49pg/L Median 14pg/L 2011’s survey