Download
1 / 21
210 likes | 391 Views
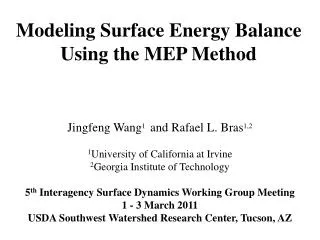
Quality controlled data base of the COPS surface energy balance network. Thomas Foken, Rafael Eigenmann Dept. Micrometeorology, University of Bayreuth www.bayceer.uni-bayreuth.de/mm. 7 th COPS Workshop 27 th -29 th October 2008, Strasbourg. Content. Energy balance group: an overview

E N D
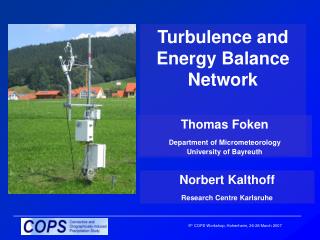
Quality controlled data base of the COPS surface energy balance network Thomas Foken, Rafael EigenmannDept. Micrometeorology, University of Bayreuthwww.bayceer.uni-bayreuth.de/mm 7th COPS Workshop 27th-29th October 2008, Strasbourg
Content • Energy balance group: an overview • Turbulence data processing • Turbulence quality control: • Part 1: Turbulence flux calculation • Part 2: Footprint analysis • Part 3: Internal boundary layer evaluation • WDCC data base • Conclusion
Energy balance network • Organisation: http://www.bayceer.uni-bayreuth.de/COPS/
Turbulence data processing with TK2 Processing steps and applied flux corrections: • Calculation of averages, variances and covariances for 30 min averaging intervals • Correction of a time delay between different sensors by cross correlation • Spike test • Cross-wind correction • Planar fit coordinate rotation • Correction of spectral loss • Conversion of buoyancy into sensible heat flux • WPL correction (Vickers and Mahrt, 1997) (Wilczak et al., 2001) (Moore, 1986) (Schotanus et al., 1983; Liu et al., 2001) (Webb et al., 1980; Fuehrer and Friehe, 2002; Liebethal and Foken, 2003, 2004)
EC-data quality check Test on steady state conditions (Foken and Wichura, 1996, Foken et al. 2004)
EC-data quality check Test on developed turbulence (Foken and Wichura, 1996, Foken et al. 2004)
EC-data quality checkOverall flagging of data (Foken and Wichura, 1996, Foken et al. 2004)
EC-data quality checkOverall flagging of data good moderate bad do not use (Foken and Wichura, 1996, Foken et al. 2004)
Turbulence data quality (I) • Post-field quality control • Steady state test • Test for integral turbulence characteristics combined flag (1 to 9) will be uploaded to the WDCC data base within a flux NetCDF-file (Foken et al., 2004; Foken and Wichura, 1996) • Classes 1-3: suitable for fundamental research • Classes 4-6: only for monthly or annual sums • Classes 7-8: rough orientation • Class 9: data should always be rejected
Accuracy of surface fluxes Foken and Oncley (1995), Mauder et al. (2006) Eddy-covariance measurements according to recent findings (EBEX-2000 in USA and LITFASS-2003 in Germany)
Energy balance closure problem Foken and Oncley (1995), Mauder et al. (2006), Oncley et al. (2007), Mauder and Foken (2006), Foken (2008)
Energy Balance Closure Problem Foken and Oncley (1995), Mauder et al. (2006), Oncley et al. (2007), Mauder and Foken (2006), Foken (2008) WHAT IS TO DO BY THE USER? Distribute the residual according to the Bowen ratio to the sensible and latent heat flux
Internal Boundary Layers Stull (1988)
Internal boundary layers • Internal boundary layers • Flagging scheme for each 30 min flux value in the NetCDF-file 2 1 0
Footprint analysis • Combination of the flux quality approach with a forward Lagrangian footprint model (Göckede et al., 2004, 2006; Foken et al., 2004; Rannik at al., 2003) • Spatial representativeness • (footprint climatology) • Spatial distribution of • quality flags
Turbulence data quality (II) Footprint analysis: Flux contribution from the target land use Internal boundary layer evaluation: Height of internal boundary layer
Supplementary FOOT file • 6 pictures per station: • Land use information map (on which your footprint analysis is based on): • Footprint climatology: • Spatial distribution of quality flags in relation to footprint climatology for u*, QH, QE, CO2:
WDCC data base structure • Each station comprises 2 data sets: • And 1 supplementary file (FOOT) Land use information map, footprint analysis • Additional information possible (e.g. TK2 manual, references …) Meteorological (MET): Radiation and soil measurements Flux data set (FLUX): Turbulent fluxes, footprint analysis, IBL
Conclusion We will write a cook book for the user.