Download
1 / 65
660 likes | 915 Views
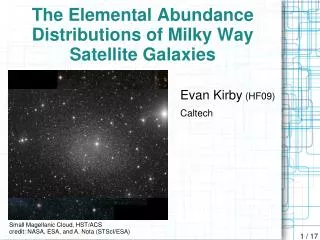
Combinatorial insights into distributions of wealth, size, and abundance. Ken Locey. Rank-abundance curve (RAC). Species abundance distribution (SAD). Frequency distribution. frequency. Abundance. Rank in abundance. Abundance class. Ranked curve ( RC ).

E N D
Combinatorial insights into distributions of wealth, size, and abundance Ken Locey
Rank-abundance curve (RAC) Species abundance distribution (SAD) Frequency distribution frequency Abundance Rank in abundance Abundance class
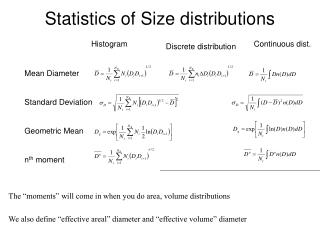
Ranked curve (RC) Distributions of wealth, size, abundance Frequency distribution frequency Abundance/wealth/size Rank in abundance, wealth, or size Abundance, wealth, or size class
Poverty in Rural America, 2008 54 – 25.1 25 – 20.1 12 – 10.1 10 – 3.1 20 – 14.1 14 – 12.1 Percent in Poverty
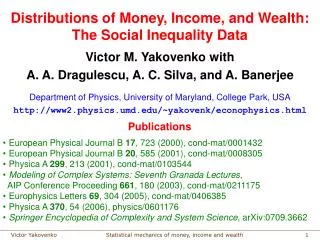
Distributions used to predict variation in wealth, size, & abundance • Pareto (80-20 rule) • Log-normal • Log-series • Geometric series • Dirichlet • Negative binomial • Zipf • Zipf-Mandelbrot
Rank-abundance curve (RAC) Predicting, modeling, & explaining the Species abundance distribution (SAD) Frequency distribution frequency Abundance Rank in abundance Abundance class
Predicting, modeling, & explaining the Species abundance distribution (SAD) 104 Observed Resource partitioning Demographic stochasticity 103 Abundance 102 101 100 Rank in abundance
Predicting, modeling, & explaining the Species abundance distribution (SAD) 104 N = 1,700 S = 17 103 Abundance 102 101 100 Rank in abundance
How many forms of the SAD for a given N and S? 104 103 Abundance 102 101 100 Rank in abundance
Integer Partitioning Integer partition: A positive integer expressed as the sum of unordered positive integers e.g. 6 = 3+2+1 = 1+2+3 = 2+1+3 Written in non-increasing (lexical) order e.g. 3+2+1
Rank-abundance curves are integer partitions Rank-abundance curve Integer partition N = total abundance S = species richness S unlabeled abundances that sum to N N = positive integer S = number of parts S unordered +integers that sum to N =
Random integer partitions Nijenhuis and Wilf (1978) Combinatorial Algorithms for Computer and Calculators. Academic Press, New York. Goal: Random partitions for N = 5, S = 3:
SAD feasible sets aredominated by hollow curves Frequency log2(abundance)
The SAD feasible set N=1000, S=40 ln(abundance) Rank in abundance
Question Can we explain variation in abundance based on how N and S constrain observable variation?
The center of the feasible set N=1000, S=40 ln(abundance) Rank in abundance
R2 = 1.0 102 101 100 Observed abundance R2 per site 100 101 102 Abundance at the center of the feasible set
Breeding Bird Survey (1,583 sites) R2 = 0.93 102 101 100 Observed abundance R2 per site 100 101 102 Abundance at the center of the feasible set
Observed abundance Abundance at center of the feasible set
Observed abundance Abundance at center of the feasible set
Public code and data repository https://github.com/weecology/feasiblesets
0.93 0.88 0.91 0.91 Observed home runs 0.94 0.93 Center of the feasible set http://mlb.mlb.com
Combinatorics is one only way to examine feasible sets Other (more common) ways: Mathematical optimization Linear programming
Efficient algorithms for generating random integerpartitionwith restricted numbers of parts
Random integer partitions Nijenhuis and Wilf (1978) Combinatorial Algorithms for Computer and Calculators. Academic Press, New York. Goal: Random partitions for N = 5, S = 3:
Combinatorial Explosion Probability of generating a random partition of 1000 having 10 parts: < 10-17
Task: Generate random partitions of N=9 having S=4 parts 4+3+2
3+3+2+1 4+3+2
3+3+2+1 4+3+2=9
A recipe for random partitions of N with S parts • Generate a random partition ofN - S with S or less as the largest • Append S to the front • Conjugate the partition • Let cool & serve with garnish
Generate a random partition of N-S with S or less as the largest part Divide & Conquer Top down Multiplicity Bottom up
Un(bias) Density Skewness of partitions in a random sample
Speed N = 50 N = 100 Sage/algorithm N = 150 N = 200 Number of parts (S)
Old Apples: probability of generating a partition for N = 1000 & S = 10: < 10-17 New Oranges: Seconds to generate a partition for N = 1000 & S = 10: 0.07