Download
1 / 36
370 likes | 553 Views
Measuring the performance of a biomedical digital library: web site, e-journals and databases. Paolo Gardois Biblioteca del Dipartimento di Scienze Pediatriche e dell'Adolescenza Università di Torino Alghero, 2001-06-08. Why measuring: background.

E N D
Measuring the performance of a biomedical digital library:web site, e-journals and databases Paolo Gardois Biblioteca del Dipartimento di Scienze Pediatriche e dell'Adolescenza Università di Torino Alghero, 2001-06-08
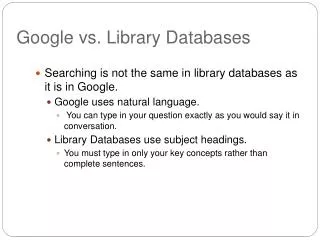
Why measuring: background • Global marketplace for scientific information... • Decreasing budgets... • Users have “no time to waste”... • … Libraries’ websites must focus on quality
Quality has two sides: • Global: taking part in... • ...union catalogues • ...library consortia • ...co-operative subject gateways • Local • tailoring services on the needs of local users • trying to acquire new users
Many strategies, a common need • marketing and advertising techniques • acquiring a more important role in users’ education • integration with other departments working on the same issues • integration with the scientific research (university press, assistance to authors)… require feedback from users
Feedback in a digital library: • Good opportunities: analysis of • server log • databases queries • Difficulties: • raw data must be carefully interpreted • a good analysis assumes a good knowledge of your users
What I have tried to measure • Library’s web site • E-journals usage • Usage of bibliographic databases
…and data • URL: <http://www.pediatria.unito.it/biblio/> • Total directories: 9 • Total files (only HTML and image files): 67 • Services offered: • information about the library • access to e-journals, catalogues and databases • biomedical internet resources described and indexed • information about seminars and other training events for clinicians and researchers • occasionally, web pages collecting teaching materials • Number of potential institutional users: • 1500 clinicians, nurses, other staff and professionals working in the OIRM S. Anna Maternal and Child Care Hospital of Turin (Italy)
Period of analysis Sample log line • 14 months in a period of 17 months, from september 1999 to january 2001 • 212.210.172.4 - - [03/Aug/2000:15:31:55 +0200] "GET /biblio/ej/ejs.html HTTP/1.0" 200 35111 • Limitations: • referrer function and user agent recognition not enabled Software: • Web Trends Log Analyzer v5.0e (1999) for general statistics, most requested pages, visitors • Mach 5 FastStatsAnalyzer v2.78 (2000) for geographical location of users and technical statistics.
Cache and proxy servers: a problem • Browser and server cache speed up connections but hide several hits • Proxy servers hide IP addresses of single users
Most requested pages • Home page: 24% of total page views • Alphabetical list of e-journals: 11% • Description and link to Pubmed: 8% • The home page is also the top entry page (36% of total) and the top exit page (24% of total).
Defining a user: • From log files we don’t know: • how many people are sitting in front of a computer browsing our site • if a computer is used always and only by the same person, or if it is a shared computer • ISP assign IP dynamically: different IPs do not always mean different users • Proxy servers hide single IP addresses • USER: • a single IP address or domain name accessing the site. In this study a visitor session is considered ended when the user hasn’t performed any requests for more than 30 minutes.
the majority of users (85%) haven’t come back to the site after visiting it the first time. It is then necessary to study new strategies to attract the user with more peculiar content
The average length of visit for this web site is 10:03 minutes. Anyway, 77% of users has spent less than one minute on the site
In 63% of visits, users have downloaded only one web page from the site
Hits from internal and external visitors • in the first period most of the hits came from within the institution, while in the final period the situation is exactly the opposite: 2/3 of users access the site from outside the institutions. • They might not be other (new) users, though, but simply institutional users accessing the site also from outside the institution
For this analysis it is necessary to have a reverse DNS lookup performed by the log analysis software connected to the Internet
Technical analysis • 15% of hits have resulted in an error message. The great majority are code 404 (page not found): the URL in a link (internal or external to the site) is not correct, or the user hasn’t typed in the correct URL, or the requested page has been moved. • Another frequent code of error is 206 “requested file not completely downloaded”. This problem can be caused either by an excessive length of the file (the user doesn’t want to wait and then moves to another page before completing the download), or by network errors.
Who points to our site? • An alternative strategy to using the referrer function: • using the advanced search function of some search engines, searching for the name of your web site in the links belonging to a web page indexed in the search engine. • Altavista advanced search: 8 pages found • Fast Search advanced search: 12 pages found. • The use of such tools usually doesn’t give very clear results: we don’t know how many pages they index, the depth of indexing in a single site and the geographical coverage.
E-journals • The library’s web site delivers access to 160 e-journals (2000-10-31), through direct access to publishers sites or through EBSCO online and Ovid. • The only data available come from Ovid and EBSCO gateways, since most of the publishers don’t disclose to librarians the figures of online access for their users. • 94 journals (45 through EBSCO online, 49 through Ovid) – 59% of total – were available for the analysis. • Since the statistical analysis packages differ considerably, the parameters taken into account are quite different.
OVID: journals available • Our institution accesses 49 online full text journals (SGML format) through the Ovid package, grouped in the Core Biomedical Collection, Nursing Collection and Nursing Collection II. • The journals are available for the network of the University Pediatrics department and Ginecology Department, located in the OIRM S. Anna hospital for maternal and child care in Turin. • Using Ovid statistics viewer I have analyzed the usage of journals both by paediatricians and by gynaecologists in the time period between 2000-10-25 and 2001-04-29.
OVID journals: evaluation • The first ten journals are medical journals, with only two exceptions • Some journals from the list are freely available on the Internet and others were also available via the library’s web site through the publisher’s site. • 9 journals out of 49 (18%) were not accessed at all • 27 out of 49 (55%) were accessed less than 5 times. • The overall usage of these resources was very low: 690 accesses for 1000 potential users in 6 months, at a rate of 0,115 accesses per potential user per month.
EBSCO Online journals: availability • 45 journals are available for our institution via EBSCO online, in PDF o Real Page format. • Usage data were analyzed on 2001-02-07 using the EBSCO Online usage report. Usage reports were available form 2000-03-05 to 2001-01-19 for one group and from 2000-02-22 to 2001-01-19 for another. • The potential users are estimated in approximately 1500
EBSCO Online journals: access • These titles were available from the list of e-journals of the library’s web site and were accessible either by IP recognition for computers inside the institution or by login and password outside the institution. • The possibility to access these titles is higher than for the Ovid ones, accessible only via IP recognition. • It is possible to measure how many hits were on the journal, and how many on the tables of contents, abstracts and full text articles.
Online journals: final evaluation • The only comparable data (full text article hits) show that journals accessed through EBSCO Online were significantly more consulted (211 hits per month vs. 115). Considering a greater audience for EBSCO journals, though, the number of full text hits per user per month is slightly higher (0,140 vs. 0,115). • With regard to the subject, there was an average of 84 hits per months on OVID medical journals and 30 hits on Ovid nursing journals. • It is difficult but necessary to compare the usage of paper and electronic journals.
OVID Databases usage • Ovid databases are accessible to the same users and in the same way as the Ovid full text journals. SW used for analysis: Ovid Statistics Viewer. • Databases available: • CancerLit • CINAHL • EBM Reviews - Best Evidence • EBM Reviews - Cochrane Database of Systematic Reviews • Medline • Pre-Medline
OVID Databases usage • The two EBM Reviews are full text databases; the others bibliographic ones. • Medline, Premedline and Cancerlit are also available free of charge on the Internet, and this might have affected their access through Ovid. • The log files were analyzed in the same time period as the Ovid full text journals: 2000-10-25 – 2001-04-29.
OVID databases: patterns of search • Medline is the most used database: • 684 sessions out of 1025 • 4746 search sets out of 6674 • The most intensively used database during a single session is CINAHL: 8 average sets per session
OVID databases: patterns of search /2 • Author, Journal name and Title searches are performed only by few users • A good percentage of users, instead, performs subject searches (43% on average, 54% in CINAHL and 53% in Medline). This good percentage is also a consequence of the fact that Ovid performs an automatic mapping of a search string to MeSH terms in Medline and to CINAHL subject headings in CINAHL.
OVID databases: search operators • The use of search operators is widespread for • AND (24% of searches) • OR (30% of searches). • Besides, the percentage of searches in AND or OR is underestimated due to the fact that – following strictly the path proposed by Ovid, users have to perform two separate searches and then to combine them in a third separate search selecting either OR or AND by a menu. • In this menu, though, are not present other operators such as NOT, ADJ or FREQ. Thus, only very few searches use the operator NOT (0,21% of total search sets) and almost none ADJ or FREQ.
General conclusions / 1 • There is a strong need for internationally acknowledged guidelines for the analysis of this kind of data. Particularly, a set of basic parameters and an agreement on what each parameter means seem to be necessary • No rigid structures, but a set of tools to improve the comparability of various analyses performed in different contexts. • The set of parameters should have the necessary flexibility to be adapted to the particular needs of local communities of users. • Secondly, a more uniform format for data. Pre-packed software for log analysis suffers from heavy limitations. What I have found abut the analysis of usage data for e-journals and databases are very rigid tools with insufficient space for personalization, and – what is more – no direct access to raw data. This last point is vital, though. Only studying (and configuring from the beginning in an appropriate way) directly the server logs it is possible to obtain more precise results.
General conclusions / 2 • A more uniform format for data is needed. Pre-packed software for log analysis suffers from heavy limitations: very rigid tools with insufficient space for personalization, and no direct access to raw data. • Only studying (and configuring from the beginning in an appropriate way) directly the server logs it is possible to obtain more precise results.