Download
1 / 34
340 likes | 484 Views
Enrollment, Projections, and Capacity in the Arlington Public Schools December 2006. Demographics. Students on Free/Reduced Lunch. 2001-2002 38.31% 2002-2003 37.65% 2003-2004 35.84% 2004-2005 36.09% 2005-2006 35.02% 2006-2007 33.83%. Enrollment Trends.

E N D
Enrollment, Projections, and Capacity in the Arlington Public Schools December 2006
Students on Free/Reduced Lunch 2001-2002 38.31% 2002-2003 37.65% 2003-2004 35.84% 2004-2005 36.09% 2005-2006 35.02% 2006-2007 33.83%
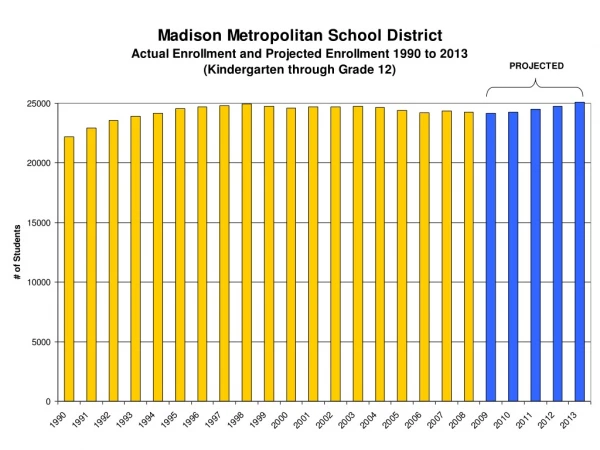
Enrollment Trends • From 2001-2005, APS has experienced declining enrollment system-wide K-12 populations • 2006: Increase of 13 K-12 students • Decline of 871 K-12 students in 5 years • Expect continued decline system-wide for a few years, expect eventual reverse • Decline is not equally distributed geographically or by ethnic groups
September 30, 2006 Count Total Pre-K–12 Enrollment: 18,451 Compared to September 30, 2005: K – 12: +13 K – 5 : +77 6 – 8: -37 9 – 12: -21
Projection Methodology • School-specific projections are based on 3-year cohort-survival averages • If a school’s K to 1st grade growth rate averages 5%, the current K will be multiplied by 105% to project next year’s 1st grade • Kindergarten is based on “capture rate” for the system and Arlington’s birth rates for 5 years prior • Generally, enrollment is within 1-2% of projections system-wide
School Year 2006 Building capacity: 20,213 Utilization rate: 89.4% Countywide seats available: 2,144 School Year 2011 Building capacity: 20,373 Utilization rate: 88.9% Countywide seats available: 2,261 Capacity Analysis
Board Criteria on Boundary Changes • Assign students to a school who reside in proximity to that school including those who live in safe walk zones. • Keep neighborhoods together. • Avoid creating elementary school boundaries that do not contain the school to which students are assigned. • Minimize transportation times. • Minimize future capital and operating budget costs. • Promote demographic diversity. • Avoid causing students who have continued to reside in a particular geographic area to be affected by boundary change more than once at a particular school level, (e.g. elementary, middle, high). • Avoid separating small numbers of students from their classmates when they move to a school at the next level.
Guiding Principles of Boundary and Enrollment Adjustment Committee • Reach school consensus on capacity numbers, enrollment projections, and the scope of the problem • Options should maintain or enhance the fundamental character of the eleven excellent schools involved in this process unless a school itself wishes to change • Pursue enrollment adjustments before considering boundary changes • Move the fewest number of students to different schools, while achieving the School Board’s goal of better matching building capacity to enrollment
Board Actions -- 2004 Boundary Process • Monitor and assess over a period of two school years the impact and effectiveness of each of the recommendations with preliminary reports on transfers and enrollment • Create Barrett Cluster • Provide staff support for exemplary project development • Revise admissions policy to 95% capacity • Continue freeze of out-of-team transfers • Move Montessori class from McKinley to Ashlawn • Move three planning units from Taylor • Grandfather rising Grades 3, 4, and 5 • Move new planning unit to Long Branch
Capacity, Enrollment, and Transfers 2006-2007
Recommendation #1 • Survey of northwest corner households as to: • Number of pre-Kindergarten age children in household • Ages of children • Expectation of continuing to reside in Arlington • Expectation of attending APS
Recommendation #2 • Series of enrollment adjustments through moving of programs and/or site adjustments: • Tuckahoe PreK Special Ed to TBD (for one year) • McKinley Montessori to Ashlawn or Barrett • McKinley PreK Special Ed to be combined with another PreK Special Ed • Nottingham Interlude to TBD • Freeze team transfers to Science Focus
Recommendation #3 System-wide task group process (February 2007 to mid-October 2007) to look at enrollment and capacity at elementary schools in context of Multi-Site Committee recommendations, survey described in #1, and impact of Head Start.
Task Group Membership • 2 citizen co-chairs appointed by the School Board • 10 citizens recommended by CCPTAs • 1 representing Immersion • 1 representing ATS/Drew • 1 representing Barrett/Campbell • 1 representing the Team • 1 for each school over 101% capacity for the six years of projections (McKinley and Tuckahoe) • 4 representing other APS neighborhood schools • 10 staff members • 1 representing Immersion • 1 representing ATS/Drew • 1 representing Barrett/Campbell
Task Group Membership • 1 representing the Team • 1 for each school over 101% capacity for the six years of projections (McKinley and Tuckahoe) • 4 representing other APS neighborhood schools • 1 citizen representative from Facilities Advisory Committee • 1 citizen representative from Advisory Council on Instruction • 2 at-large citizen representatives • Staff Liaisons: • Assistant Superintendent, Administrative Services • Special Projects Coordinator • Facilities Planner
Next Steps • January 4, 2007 – School Board will discuss staff recommendations on a boundary process and/or enrollment adjustments • January 18, 2007 – The School Board will act on staff recommendations on a boundary process and/or enrollment adjustments
Important Links – Data Free/Reduced Lunch: http://www.arlington.k12.va.us/IS/plan_eval/demog/free_lunch.shtml Civil Rights Statistics: http://www.arlington.k12.va.us/IS/plan_eval/demog/civil_rights/ Survey of Limited English Proficient Students: http://www.arlington.k12.va.us/instruct/esol_hilt/downloads/lep_survey_2005.pdf Enrollment Data: http://www.arlington.k12.va.us/IS/plan_eval/demog/month_enroll/ Projections: http://www.arlington.k12.va.us/IS/plan_eval/demog/enroll_proj/fallprojections07-12.pdf
Average K from 2000-06: 66 students 2006 K: 93 students, 41% higher