Download
1 / 20
200 likes | 313 Views
Restoring environmental damage: losing less and gaining more. Nicola Eury Principal. Presentation content. Introduce Ecosystem Services (ES) concept Explicit or implicit references to use of ES in damage restoration law

E N D
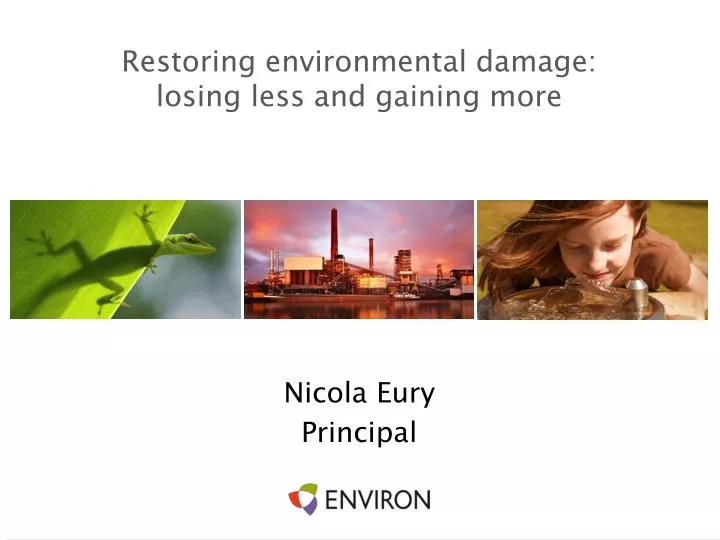
Restoring environmental damage: losing less and gaining more Nicola Eury Principal
Presentation content • Introduce Ecosystem Services (ES) concept • Explicit or implicit references to use of ES in damage restoration law • How to use an ES approach to respond to works/enforcement notices to optimise mitigation remediation and restoration
Ecosystem Services: “The Benefits people obtain from ecosystems”
Ecosystem Services Approach to dealing with Damage • ED Regulations 2009: remediation options must be evaluated using best available methods, and based on (amongst others) • the extent to which each option benefits each component of the natural resource or service • the extent to which each option takes account of relevant social, economic and cultural concerns and other relevant factors specific to the locality • Civil Sanctions Act 2008 • Restore the environment to the state that it would have been in before the offence • Where restoration is not possible, ensure equivalent benefit elsewhere
Calculating the loss relative to baseline baseline services A services lost % of Services Pollutant/ Contaminant Release Time to natural recovery to pre-release condition Primary Remediation Years
Area B - Services Provided (Benefit) B A Area A - Services Lost (Loss) Calculating the Gains from Restoration Options Impacts and benefits are based on changes from the baseline 20% B 0% Baseline Ecosystem Services -20% Environmental Economics-based Approaches Years
Case Example: Diesel fuel spill into river • Diesel spill into a river • River enters into large lake • River is poor quality with minimal recreational uses • Lake provides boating, swimming, aesthetic and other recreational value to the public.
Diesel Spill Recovery Curves Water Quality 100 80 60 40 20 0 Baseline Cumulative Percent (%) Recovery Note: Initial point of lost services will vary 0 1 2 3 4 5 Years
Diesel Spill Recovery Curves Water Quality Macroinvertebrates 100 80 60 40 20 0 Baseline Cumulative Percent (%) Recovery 0 1 2 3 4 5 Years
Diesel Spill Recovery Curves Water Quality Fish Macroinvertebrates 100 80 60 40 20 0 Baseline Cumulative Percent (%) Recovery 0 1 2 3 4 5 Years
Diesel Spill Recovery Curves Water Quality Macroinvertebrates Molluscs Fish 100 80 60 40 20 0 Baseline Cumulative Percent (%) Recovery 0 1 2 3 4 5 Years
Diesel Spill Recovery Curves 100 80 60 40 20 0 Baseline Cumulative Percent (%) Recovery 0 1 2 3 4 5 Years
Example: Impact to an Aquatic System For this Example: Parameter Evaluated: Fish Density (# fish/ha) 40% 20% 0% Baseline Services - 20% A - 40% Area A Represents the Loss of Ecological Services Over Time Units: Services per Hectare per Year: (SHY’s) Area A = -850 discounted SHY’s (loss over 5 years) (600 fish/ha = 40% Loss) - 60% - 80% (200 fish/ha = 80% loss) IMPACT - 100% 2009 2010 2011 2012 2013 2014 Years Quantifying Ecological Service Losses (1,000 fish/ha)
B Area B Represents the Gain of Ecological Services Over Time Units: Services per Hectare per Year: (SHY’s) Area B = 1,250 dSHY’s(gain over 25 years) 1,100 fish/ha (Gain = 10% ) 1,200 fish/ha (Gain = 20%) 1,000 fish/ha Restoration Implementation Quantifying Ecological Service Gains Example: In-Stream Restoration (e.g., physical in stream habitat modification) 40% 20% 0% Baseline (1,000 fish/ha) - 20% % of Services - 40% - 60% - 80% -100% 2009 2010 2011 2012 2013 2014 Years
Providing Human Use Services (additional credit) e.g., Creation of Bike Trail, Hiking Trail, Park B Baseline Services Full Maturity Start of Enhancement User Days Area B is calculated in units of user days generated Years
Summary • Civil sanctions directing polluters and their advisers to using an ES approach to damage valuation • An ES approach provides defensible propositions for restoration that are not necessarily the most costly option • These approaches are supported by DEFRA and the EA
Thank you Any Questions? Nicola Eury Principal, ENVIRON UK Limited +44(0)1392 440600 neury@uk.environcorp.com