Download
1 / 8
80 likes | 240 Views
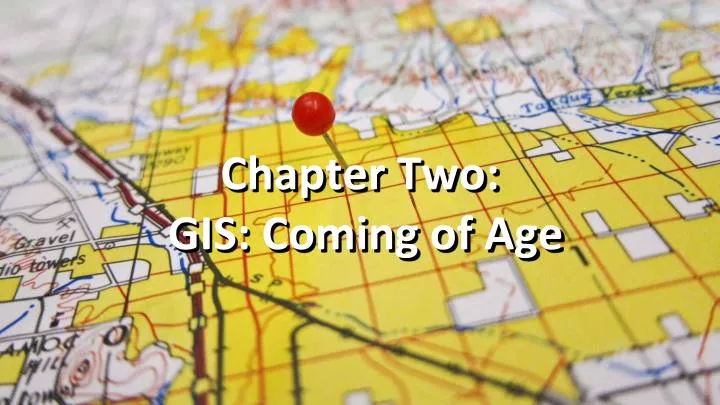
Chapter Two: GIS: Coming of Age. GIS: Coming of Age. In 1854, John Snow, an English physician, depicted a cholera outbreak in London using points to represent the locations of individual victim through a map, possibly the earliest use of geographic information in epidemiology.

E N D
GIS: Coming of Age In 1854, John Snow, an English physician, depicted a cholera outbreak in London using points to represent the locations of individual victim through a map, possibly the earliest use of geographic information in epidemiology. His study of the distribution of cholera which establishes relationship between the victims and the water source, led to the source of the disease – a contaminated water pump, thereby saving many lives. Source: http://en.wikipedia.org/wiki/Geographic_information_system http://en.wikipedia.org/wiki/John_Snow_(physician)
GIS: Coming of Age The first known use of the term "Geographic Information System" was by Roger Tomlinson, a Canadian, in the year 1968 in his paper "A Geographic Information System for Regional Planning". Tomlinson is thus acknowledged as the "father of GIS“, and the first GIS in the world was developed in Canada during the end of 1960s. Source: http://www.esri.com/news/arcnews/fall12articles/the-fiftieth-anniversary-of-gis.html http://www.esri.com/news/arcnews/fall12articles/origins-of-the-canada-geographic-information-system.html http://en.wikipedia.org/wiki/Geographic_information_system
GIS: Coming of Age The true potential of GIS was widely evident only with the establishment of the first computer-based GIS in 1986, which also signified the beginning of modern GIS. The advancement of modern GIS empowers users to capture, store, manipulate, analyze, manage, and present all types of geographical data in ever more sophisticated ways. Source: http://en.wikipedia.org/wiki/Geographic_information_system http://www.econsultsolutions.com/what-we-do/technical-apps/geospatial-analyses-gis/ http://www.geospatialtraining.com/blog/index.php/integrating-arcgis-and-google-earth-for-crime-analysis/ http://geospatial-solutions.com/the-new-age-of-real-time-gis/
Geo-Brain Tickler 3: Learn to think like John Snow…! Establish relationship between each feature (or entity) on the left , and its attributes on the right: A – Recreational Park name, speed limit, number of lanes, starting point (X,Y) B – Canal name, monthly loan volume, membership, address C – Expressway block number, number of storey, postal code D – MRT Station name, length, width, depth, ending point (X,Y) E – HDB name, number of beds, address, number of wards F – School road name, company name, number of station G – Hospital name, number of berth, total service route, postal code H – Library name, area, year established, types of facility, road name I – Petrol Station name, address, year established, total enrolment J – Bus Interchange station name, number of exits, station code, postal code
Geo-Brain Tickler 3: The Answer Learn to think like John Snow…! Establish relationship between each feature (or entity) on the left , and its attributes on the right: A – Recreational Park --- name, speed limit, number of lanes, starting point (X,Y) B – Canal ------------------- name, monthly loan volume, membership, address C – Expressway ---------- block number, number of storey, postal code D – MRT Station ----------- name, length, width, depth, ending point (X,Y) E – HDB ---------------------- name, number of beds, address, number of wards F – School ------------------ road name, company name, number of station G – Hospital --------------- name, number of berth, total service route, postal code H – Library ----------------- name, area, year established, types of facility, road name I – Petrol Station --------- name, address, year established, total enrolment J – Bus Interchange ----- station name, number of exits, station code, postal code
Geo-Brain Tickler 3: The Answer Learn to think like John Snow…! Establish relationship between each feature (or entity) on the left , and its attributes on the right: A – Recreational Park --- name, speed limit, number of lanes, starting point (X,Y) B – Canal ------------------- name, monthly loan volume, membership, address C – Expressway ---------- block number, number of storey, postal code D – MRT Station ----------- name, length, width, depth, ending point (X,Y) E – HDB ---------------------- name, number of beds, address, number of wards F – School ------------------ road name, company name, number of station G – Hospital --------------- name, number of berth, total service route, postal code H – Library ----------------- name, area, year established, types of facility, road name I – Petrol Station --------- name, address, year established, total enrolment J – Bus Interchange ----- station name, number of exits, station code, postal code Notice the “location” element in each feature’s attributes…? It is the critical info that helps display a feature on the map the geospatial “gene”…!
GeoSpatial Genes Do Exist…! Amazing isn’t it? Almost everything that we associate with in our daily lives have the geospatial genes! Want to know more? Let’s move on to the next chapter…!