Download
1 / 26
260 likes | 264 Views
This study explores the origins, theories, and methods of understanding social inequalities in health from a life course perspective. It examines critical periods, accumulation, and pathways to provide a comprehensive analysis of health disparities.

E N D
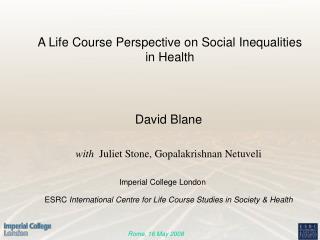
A Life Course Perspective on Social Inequalities in Health David Blane with Juliet Stone, Gopalakrishnan Netuveli Imperial College London ESRC International Centre for Life Course Studies in Society & Health
Contents • Origins • Theory • Methods • Social inequalities in health • Limits of the life course approach • Summary
Origins 1990s The life course now is a core theme in social epidemiology.
Origins Biological programming Organ development in utero (as indexed by eg. birth weight) and during infancy determines maximum function during adulthood* Examples • Lung development – adult COPD • Kidney development – adult hypertension • Pancreatic development – adult diabetes • *Barker D 1991, 1994 (BMJ Books).
Origins Birth cohort studies 1946 birth cohort at age 36 years • first use of accumulation* • risk of lower respiratory tract disease & reduced lung function at 36 accumulates with chest infections and poor, crowded housing during early childhood, air pollution exposure during later childhood and tobacco smoking during early adulthood • *Mann et al. 1992 J Epidemiol Com Health
Origins Health inequalities • Behavioural risk factors account for only c.1/3 of class difference in mortality risk.* • Mortality risk is fine grained.** • Social structure = disadvantages (or advantages) cluster cross-sectionally and accumulate longitudinally.*** • * Rose & Marmot 1981 Brit Heart J • **Goldblatt 1990 HMSO • *** Blane 1995 American J Public Health
Theory: Models of the life course • Critical periods • Accumulation • Pathways
Model: Critical periods Extends the idea of biological programming to include • Childhood • Psycho-social stress at the time of brain maturation may both inhibit child growth and mis-set the developing BP control mechanisms, producing later high BP* • Social development • Key social transitions** * Montgomery et al. 2000 Archives Disease Childhood ** Bartley et al. 1997 British Medical Journal
Model: Accumulation Disadvantages, or advantages, tend to cluster cross-sectionally • occupation + residence + area of residence + consumption and accumulate longitudinally. • childhood + adulthood + older ages This social process may have a major impact on health through the accumulation of numerous relatively minor effects.* * Blane et al. 1997 European J Public Health
Model: Pathways Early advantage or disadvantage sets a person on a pathway to a later exposure that is the aetiologically important event.* Educationally successful women (pathway) tend to delay their first pregnancy (aetiologically important event), which increases their risk of breast cancer. * Power & Hertzman. 1997 British Medical Bulletin
Models: A judgement • Models are difficult to distinguish empirically* and conceptually** • Perhaps best to see accumulation as the general socialprocess which drives life course trajectories; with critical periods and pathways, in addition to accumulation, being the biological processes of disease causation** * Hallqvist et al.2004 Social Science and Medicine ** Blane et al. 2007 Revue d’Epidemiologie et de Sante Publique
Methods • Birth cohort studies • Linked-register data sets • Epidemiological archaeology historical study + tracing to present-day location + retrospective data +/- Lifegrid (event history calendar)
Methods Birth cohort studies 1946 birth cohort • Health at 36 years* and physical disability and handicap at 43** influenced by parental social class, health during childhood and own adult social class • Poor diet*** and obesity**** at 36 years influenced by manual parental social class and few educational qualifications • * Kuh & Wadsworth 1993 Soc Sci Med • ** Kuh et al. 1994 J Epid Com Health • *** Braddon et al. 1988 J Epid Com Hlth • **** Braddon et al. 1986 Brit Med J
Methods Linked registers • Birth weight and blood pressure at age 50 years in 1300 Swedish men* • weak inverse linear relationship, only for systolic pressure • Birth weight during 1915-29 and all deaths among 14600 Swedish men & women to 1995** • weak inverse relationship for cardiovascular disease deaths, only for men • * Leon et al. 1996 British Medical J • **Leon et al. 1998 British Medical J
Methods Epidemiological archaeology Boyd Orr lifegrid sub-sample • Height measured during childhood in 1937-39 • Height and blood pressure measured during early old age in 1997-98 • Child growth (child height conditioned on adult height) predicted pulse pressure and systolic blood pressure 60 years later.* • * Montgomery et al. 2000 Arch Dis Child
Health inequalities and life course • Predictive power • Aetiological insights • Health inequality debates • Social policy implications
Inequalities Predictive power West of Scotland Collaborative Study • Life course socioeconomic position (child, first job and adult manual social class, range 0-3) predicted systolic and diastolic blood pressures, serum cholesterol concentration, height, body mass index, lung function (FEV1), symptoms of angina and chronic bronchitis and 21-year mortality risk. • * Davey Smith et al. 1998 Brit Med J
Inequalities Aetiological insights West of Scotland Collaborative Study* • cause-specific mortality and mutually adjusted child & adult social class • Lung cancer mostly adult class • Coronary heart disease and respiratory disease accumulating child and adult class • Stroke and stomach cancer mostly child class • * Davey Smith et al. 1998 Brit Med J
Inequalities Unresolved debates • General susceptibility* • Mortality risk determined by balance of advantage and disadvantage • Cause of death determined by specifics of an individual’s social trajectory • Gradient constraint** • Health-related social mobility constrains, rather than creates, widening inequalities • * Blane et al. 1997 European J Pub Health • ** Bartley & Plewis 1997 J Hlth Social Beh
Inequalities Social policy implications • Traditional welfare state safety netsassume that misfortune soon will be replaced by the person’s normal, more advantaged, state. • The accumulation model draws attention to the likelihood that misfortune will have been preceded by earlier disadvantages, requiring a springboardto repair previous damage.* • * Bartley et al. 1997 British Medical J
Limits of the life course approach. • Spectrum of impact. • Major social disruption. • Effect diluted at older ages?(speculative)
Limits Spectrum of impact • Physiological risk factors influenced by whole life course; behavioural risk factors influenced mainly by current context* • Modest life course influences on diet at older ages** • Quality of life at older ages influenced mainly by current circumstances*** • * Blane et al. 1996 British Medical J • ** Maynard et al. 2006 Eur J Pub Hlth • *** Wiggins et al. 2004 Ageing & Society
Limits Major social disruption • Many areas of health where life course perspective adds little • Not an alternative to a concern with the cross-sectional and immediate • Acute shortening of life expectancy that followed end of USSR in 1989 (life course might help explain particular vulnerability of single men)* • * Watson 1995 Social Science and Medicine
Limits Dilution at older ages? Norwegian linked registers • 19,000 people aged 70 years in 1990, traced back to 1960 and forward to all deaths during 1990-1998 • Social gradient in mortality explained mostly by social position in 1990, with minor cumulative effects 1960-1980* • Is life course effect weakened at older ages? • * Naess et al. 2006 Social Science & Med
Summary • Life course approach not relevant to all aspects of health inequalities. • Most relevant to inequality in chronic disease morbidity and mortality. • Accumulation is main social process and one of the three aetiological processes.
Follow-up contact E-mail: d.blane@imperial.ac.uk Website of ESRC International Centre for Life Course Studies in Society and Health:www.ucl.ac.uk/icls.