Download
1 / 37
370 likes | 471 Views
MACROECONOMICS I. Class 2. National Accounts (Cont). Introduction to Economic Growth. February 28 th , 201. Class Outline. Real GDP: Chain-weighted approach GDP deflator Introduction to economic growth. GDP: Three Equivalent Approaches. 1. Production approach (value-added).

E N D
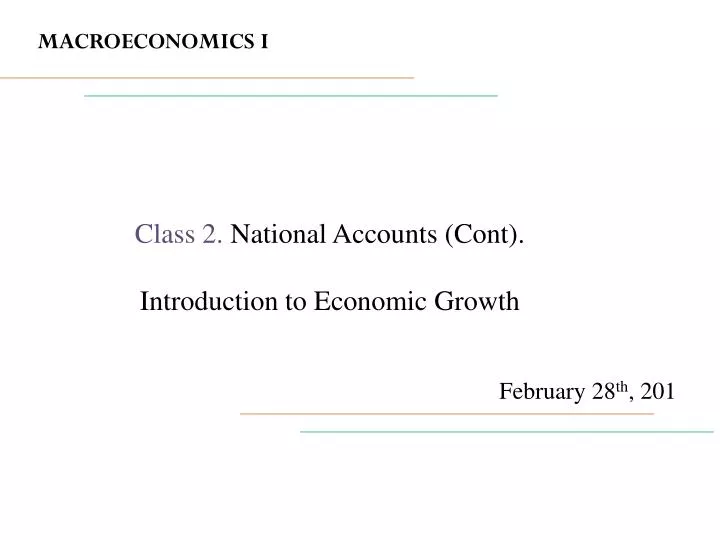
MACROECONOMICS I Class 2.National Accounts (Cont). Introduction to Economic Growth February 28th, 201
Class Outline • Real GDP: Chain-weighted approach • GDP deflator • Introduction to economic growth
GDP: Three Equivalent Approaches 1. Production approach (value-added) 2. Income approach 3. Expenditure approach Why are they equivalent ?
THE CIRCULAR FLOW MODEL OF MARKET ECONOMY Expenditure ($) Bicycles Firms Households Total production = =Total income = =Total expenditure Labor Income ($) The rule of accounting: Expenditure of buyers = Income of sellers
GDP by the Expenditure Approach Source: Czech Statistical Office. Qatar Ministry of development planning and statistics.
GDP by the Expenditure Approach Source: Czech Statistical Office. Qatar Ministry of development planning and statistics.
GDP Variations • Expressed in current prices • Expressed in constant prices GDP • Removing seasonal pattern • Adjustment for differences in standards of living
Seasonally Adjusted GDP • Quarter-to-quarter fluctuations • A pronounced seasonal pattern: • Steady growth over the year - peaking in Q4 - sharp drop in Q1 Source: IMF Financial Statistics Database
PPP Adjusted GDP • Comparing the standards of living (GDP per capita) across countries • Converting GDP into common currency using currency exchange rates • Issues: • 1. Variation of exchange rates • 2. Difference in prices of basic goods • Solution: using a common set of prices which reflects the purchasing power • Purchasing power parity: The price of a typical basket of goods is equal across countries being converted into the common currency
Real GDP: The Chain-Weighted Approach • GDP growth rate: • The growth rate is affected by the choice of the base year • What year to choose?
Real GDP: The Chain-Weighted Approach TE Real GDP (100=2010)? Real GDP growth rate?
Real GDP: Example (Cont.) Real GDP (100=2011)
Real GDP: Example (Cont.) Real GDP (100=2012)
Real GDP: The Chain-Weighted Approach Three step procedure: Step 1
Real GDP: The Chain-Weighted Approach Three step procedure: Step 2
Real GDP: The Chain-Weighted Approach (Cont.) Three step procedure: Step 3 GDPCW2011= GDP2010 (1+gR2011) GDPCW2012= GDPCW2011 (1+gR2012) • In order to calculate next year real GDP, we need to know the previous year figure • If we start from year 2011, real GDP for 2010 is GDPCW2010= GDP2011 /(1+gR2011)
The GDP Deflator • Changes in the overall price level between the base year and the current year • The price of output relative to itheprice in a base year • GDP Deflator(t) = Nominal GDP (t)/Real GDP(t) • It is an index • Equals to 1 or 100 in the base year • Its level has no economic interpretation • Removes the inflation out of nominal GDP
The GDP Deflator (Cont.) • US GDP deflator (100=2005) • GDP Deflator (2006) = 103 • Increase in overall prices by 3 % relative • to the base year • GDP Deflator (2000) = 88.7 • Increase in overall prices between 2000 and 2005 by 11.3 % compared N!B! Deflator shows the change in prices relative to the base year
The GDP Deflator (Cont.) • Inflation – a change in aggregate price level from one year to another
GDP as a Measure of Well-Being • GDP does not account for: • Non-marker transactions • Leisure • Improved product quality • Distribution of income • Quality of environment • Depletion of resources • Developed by Simon Kuznets in 1930 for BEA as a tool which allows to monitor the effect of government policy
Data Sources Czech Republic: Czech statistical office Český statistickýúřad (CSU) www.czso.cz Czech National Bank: Global Economics Outlook USA U.S. Bureau of Economic Analysis (BEA) www.bea.gov European Union Directorate General on Economic and Financial Affairs of the European Commission http://ec.europa.eu/economy_finance/eu/index_en.htm OECD www.oecd.org
Long Run: Economic Growth • Definition: Increase in real GDP per capita • Two aspects • Changes in GDP per capita within one country over time • Tremendous differences in GDP per capital across countries • The World Bank Classification based on GNP per capita • Low income: < $1,005 • Middle income: $1,006 –$12,000 • High income: >$12,000
Economic Growth Changes over time Source: Mankiw (2011)
Economic Growth (Cont.) • Distribution of countries according to PPP-adjusted real GDP per capita Distribution shift to the right => Increasing inequality across countries Source: Acemoglu, D. (2009)
Economic Growth (Cont.) • How can the US be 32 times richer than Bangladesh? • Different growth rate • TE If we take two countries with the same GDP per capita • One country is growing at 2 % per year • Another country is not growing (0% per year) • In 200 years
The evolution of GDP per capita, 1960-2010 Log GDP USA UK S. Korea Botswana Singapore Guatemala India Nigeria
Logarithmic Scale • If GPD per capita grows at a constant rate of 2 % per year, the value of GDP per capita increases by larger and larger increments over time • TE Exponential growth X Time
Logarithmic Scale (Cont.) • The same proportional increase in GDP per capita is represented by the same vertical distance on the scale (constant growth rate) Linear growth LogX Time
Fundamental Causes • The factors potentially affecting why societies make different technology and capital accumulation choices • Geographical differences • Nature, physical, ecological, and geographical environment • Institution • Laws, regulations, enforcement of property rights • Culture • Values, preferences, and believes • Luck (multiple equilibrium): divergent passes of the economies which are otherwise identical
The Vicious Circle of Poverty Low output and income GDP Low savings POVERTY Scarce investment capital Scarce jobs, Poor capital
Breaking the Cycle Better institutions Higher output GDP ECONOMIC GROWTH Investment capital Better jobs, Technology
Correlates of Economic Growth • Investment in physical capital Source: Acemoglu, D. (2009)
Correlates of Economic Growth (Cont.) • Investment in human capital Source: Acemoglu, D. (2009)
Next class: Solow-Swan Growth Model N!B! Reading Assignment: Handout “Theories that don’t work”