Download
1 / 13
130 likes | 228 Views
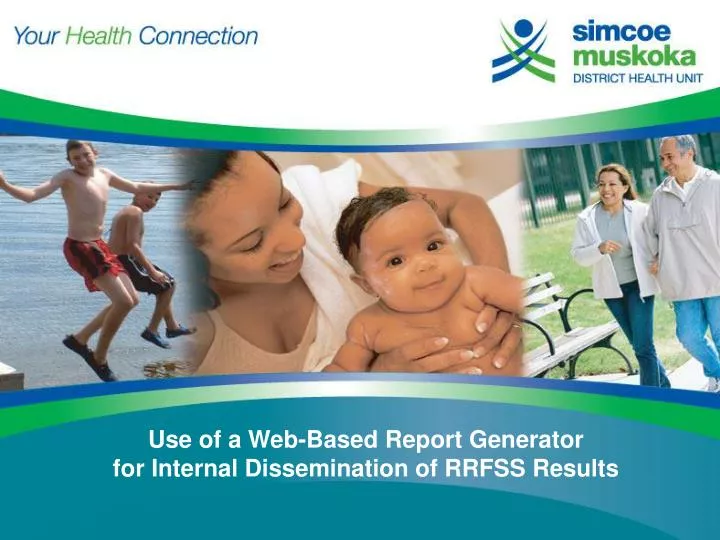
Use of a Web-Based Report Generator for Internal Dissemination of RRFSS Results. Outline. Background Process Demonstration Advantages/Limitation Questions. Background. Internal dissemination of RRFSS Use of Health Unit Intranet Supplement indicator pages

E N D
Use of a Web-Based Report Generatorfor Internal Dissemination of RRFSS Results
Outline • Background • Process • Demonstration • Advantages/Limitation • Questions
Background • Internal dissemination of RRFSS • Use of Health Unit Intranet • Supplement indicator pages • Raise the profile of RRFSS internally
SPSS data Data analysis (SPSS) Analysis result (SPSS data format) Append to table in database (Access) Export to Excel Web-based query interface Upload database to Intranet server RRFSS report (tables / charts) Process 1. Analysis 2. Database 3. Interface
Analysis • Macros • Used by all syntax files • For calculating: seasonal weights, weighted and unweighted estimates with 95% CI for total population and select subgroups, checking release criteria • Syntax • Separate file for each module • Retrieves data set & derives variables • Calculates % and 95% CI for overall & subgroups • Defines all titles & labels needed for queries, tables & charts • Aggregates data into one file • Exports to an Excel file linked to database
Database • MS Access database • Set table structure • Add data from the Excel via an Append Query • Upload to Intranet server • Through a secure page on Intranet • Synchronize DB from internal network to applications data folder
Web Interface • Dynamic SQL statement – user defined • Create HTML tables & graphical charts • Output final page structure browser
QueryParameters Query Page Passes parameters into the SQL statement to build the report
Table – Totals StartWave Indicator EndWave Area LabelHeading Labels Releasent
Table - Subgroup GroupHeading Group
Chart Indicator Area EndWave StartWave
Efficient Centralized Dynamic Customizable Cost # data requests Garbage In / Garbage Out Not a “magic bullet” – (analysis still required) Technical expertise Software / hardware requirements Interpretation Advantages & Limitations
Questions John Barbaro, Research AnalystSimcoe Muskoka District Health Unit John.Barbaro@smdhu.org1-705-721-7520 ext. 7310 Kevin Pipher, Webmaster Simcoe Muskoka District Health Unit Kevin.Pipher@smdhu.org1-705-721-7520 ext. 7211