Download
1 / 21
210 likes | 317 Views
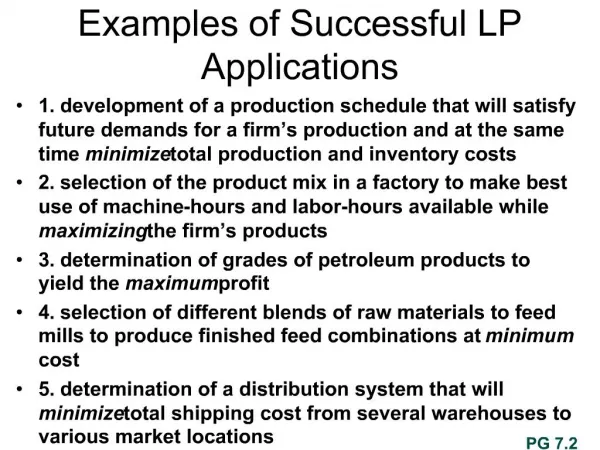
LP Applications III. The Diet Problem, And Inventory Holding Over Time Periods. The Diet Problem.

E N D
LP Applications III The Diet Problem, And Inventory Holding Over Time Periods FOMGT 353 Introduction to Management Science
The Diet Problem • The following foodstuffs contain vitamins A, B, C, and D. They also have a calorific content, a “Bad Cholesterol” content and a price per pound. The objective is to ensure a good diet defined as certain daily minimum levels of the vitamins and calories as well as certain daily maximum levels of calories and “Bad Cholesterol”. FOMGT 353 Introduction to Management Science
The Diet Problem Cont… • What is the recommended minimum cost diet based on these criteria? • Changing the price of Apples only, within what limits does the solution remain the same? • We decide we can get away with only 1,600 calories a day. How does the solution change? • We decide to increase the maximum level of “Bad Cholesterol” from 500 to 1,500 does the Sensitivity analysis allow us to predict the change in the Objective Function Value? • If we decrease the maximum level of “Bad Cholesterol” from 400 to 500, what is the effect on the Objective Function Value? • Could you manage this diet? What would you do to the model to make the result more realistic? FOMGT 353 Introduction to Management Science
The Decision Variables and The Objective Function • We are trying to decide how much of each foodstuff to include in our diet, so the Decision Variables are: • “Eggs”, “Beef”, “Bread”, “Apples” and “Spinach”. • The Objective is to minimize the cost: • Min 0.75 Eggs + 4.6 Beef + 3.0 Bread + 2.30 Apples + 2.50 Spinach. FOMGT 353 Introduction to Management Science
Constraints • Our diet requires minimum levels of Vitamins and Calories and maximum levels of “Bad Cholesterol” and Calories, so these are the constraints: • Min A. 12 Eggs + 10 Beef + 5 Bread + 12 Apples + 0 Spinach => 100 • Min B. 2 Eggs + 12 Beef + 15 Bread + 7 Apples + 5 Spinach => 120 • Min C. 0 Eggs + 0 Beef + 0 Bread + 200 Apples + 1,000 Spinach => 2,000 • Min D. 2 Eggs + 40 Beef + 2 Bread + 0 Apples + 20 Spinach => 85 • Max “Bad”. 150 Eggs + 200 Beef + 25 Bread + 0 Apples + 0 Spinach <= 500 • Min Calories. 250 Eggs + 500 Beef + 125 Bread + 90 Apples + 150 Spinach => 1,800 • Max Calories. 250 Eggs + 500 Beef + 125 Bread + 90 Apples + 150 Spinach => 1,800 FOMGT 353 Introduction to Management Science
The Model In Excel FOMGT 353 Introduction to Management Science
The Answer Report The Min Calories Constraint is not binding so the model will be unchanged if we reduce it to 1,600! • So we are going to eat 4.57 lbs of Apples and 4.32 lbs of Bread!! • The total cost will be $32.96!! (shows what Andrew knows about food prices!!) FOMGT 353 Introduction to Management Science
The Sensitivity Report We cannot say what would happen if the RHS of the Max Bad constraint were increased by 1,000 since the Allowable Increase is only 559! The model is OK for predicting what happens if the RHS of the constraint is reduced by 100! The Shadow Price tells us that for every 1 decrease the costs will increase by 0.005169879 FOMGT 353 Introduction to Management Science
Making the Model More Realistic • This much Bread and Apples would not be eatable! • So, place reasonable upper bounds on the amount of each foodstuff to be eaten, e.g. • Bread <= 1 and Apples <= 1 • Add more foodstuffs to the mix and re-run the problem. FOMGT 353 Introduction to Management Science
Inventory Holding Over Time Periods • The production manager for the Classic Boat Corporation must determine how many units of the Classic 21 model to produce over the next four quarters. • The company has a beginning inventory of 100 Classic 21 boats, and demand for the four quarters is 2000 units in quarter 1, 4000 units in quarter 2, 3000 units in quarter 3, and 1500 units in quarter 4. • The firm has limited production capacity in each quarter. That is, up to 4000 units can be produced in quarter 1, 3000 units in quarter 2, 2000 units in quarter 3, and 4000 units in quarter 4. • Each boat held in inventory in quarters 1 and 2 incurs an inventory holding cost of $250 per unit; the holding cost for quarters 3 and 4 is $300 per unit. • The production costs for the first quarter are $10,000 per unit; these costs are expected to increase by 10% each quarter because of increases in labor and material costs. • Management has specified that the ending inventory for quarter 4 must be at least 500 boats. FOMGT 353 Introduction to Management Science
If In Doubt Draw a Picture! FOMGT 353 Introduction to Management Science
Decision Variables and Objective Function • Hopefully the Decision Variables fall out of the picture as: • Q1Production, Q2Production, Q3Production, Q4Production, Q1Inventory, Q2Inventory, Q3Inventory, Q4Inventory. • The Objective is to minimize the cost of production, by holding inventory, which itself has a cost! So… • Min 10,000 Q1Production + 11,000 Q2Production + 12,100 Q3Production + 13,310 Q4Production + 250 Q1Inventory + 250 Q2Inventory + 300 Q3Inventory + 300 Q4Inventory. FOMGT 353 Introduction to Management Science
Constraints What is missing? • Closing Inventory: Q4Inventory => 500 • Qterly Production Ceilings: • Q1Production <= 4,000, • Q2 Production <= 3,000, • Q3Production <= 2,000 and • Q4Production <= 4,000. FOMGT 353 Introduction to Management Science
Flow Conservation Constraints • We need to leave nothing and take nothing from each Quarter! The sum of the incoming flows less the outgoing flows must equal zero! • Q0Inventory + Q1Production – Q1Demand – Q1Inventory = 0 • Q1Inventory + Q2Production – Q2Demand – Q2Inventory = 0 • Q2Inventory + Q3Production – Q3Demand – Q3Inventory = 0 • Q3Inventory + Q4Production – Q4Demand – Q4Inventory = 0 FOMGT 353 Introduction to Management Science
The Model in Excel FOMGT 353 Introduction to Management Science
Another Look at The Diagram… So,… the company is better off producing boats in advance and keeping them in inventory!! So,… they will produce 4,000 in Q1 and carry 2,100 as inventory to Q2! So,… they will produce 3,000 in Q2 and carry 1,100 as inventory to Q3! So,… they will produce 2,000 in Q3 and carry 100 as inventory to Q4! The cost of a boat produced in Q1 and stored till Q2 is less than the cost of a boat produced in Q2!!! The cost of a boat produced in Q2 and stored till Q3 is less than the cost of a boat produced in Q3!!! The cost of a boat produced in Q3 and stored till Q4 is less than the cost of a boat produced in Q4!!! And,they will produce 1,900 in Q4 and carry the required 500 as inventory! FOMGT 353 Introduction to Management Science
A Guess at a Solution… • Q1Production = 4,000. Constraint Binding. • Q2Production = 3,000. Constraint Binding. • Q3Production = 2,000. Constraint Binding. • Q4Production = 1,900. Constraint has slack of 2,100. • Q1Inventory = 2,100. • Q2Inventory = 1,100. • Q3Inventory = 100. • Q4Inventory = 500. Constraint Binding. FOMGT 353 Introduction to Management Science
Excel’s Answer Worksheet • Our Prediction is borne out by Excel!! FOMGT 353 Introduction to Management Science
A Further Look at The Diagram… By how much can we reduce the RHS of the constraint before the Basis Changes? By 100 ? As this forces Q3Inventory to zero and out of the Basis! By how much can we reduce the RHS of the constraint before the Basis Changes? By 100 ? As this forces Q3Inventory to zero and out of the Basis! By how much can we reduce the RHS of the constraint before the Basis Changes? By 2,100 ? By how much can we reduce the RHS of the constraint before the Basis Changes? By 100 ? As this forces Q3Inventory to zero and out of the Basis! By how much can we increase the RHS of the constraint before the Basis Changes? By 1,900 ? At which point Production in Q4 goes to 0 and Q4Production Comes out of the Basis!! What is the Shadow Price? Make one less here means make one more in Q4 at cost of $13,310 against $11,550 for Q2 boat and Inventory costs, so Shadow Price = $ 1,760. What is the Shadow Price? Make one less here means make one more in Q4 at cost of $13,310 against $12,400 for Q2 boat and Inventory costs, so Shadow Price = $ 910. What is the Shadow Price? Constraint not binding so Shadow Price = $ 0. What is the Shadow Price? Make one less here means make one more in Q4 at cost of $13,310 against $10,800 for Q1 boat and Inventory costs, so Shadow Price = $ 2,510. FOMGT 353 Introduction to Management Science
Excel’s Sensitivity Report • Our Predictions are again correct!!! • Note that Shadow Prices and Allowable Increases and Decreases are meaningless when it comes to the Conservation Constraints. FOMGT 353 Introduction to Management Science
Reading and Homework. • Read LP Example #6 – Transportation Handout. • Homework #5 due in class on Thursday March 14th FOMGT 353 Introduction to Management Science