Download

1 / 26
260 likes | 395 Views
Intelligent Systems for Telecare. Basim Majeed, Ben Azvine, Steve Brown (BT) Trevor Martin (University of Bristol). Presentation Outline. Introduction Centre for Care in the Community Well-being Monitoring Intelligent Data Analysis Questions. Introduction Effects of the demographic shift.

E N D
Intelligent Systems for Telecare Basim Majeed, Ben Azvine, Steve Brown (BT) Trevor Martin (University of Bristol)
Presentation Outline • Introduction • Centre for Care in the Community • Well-being Monitoring • Intelligent Data Analysis • Questions
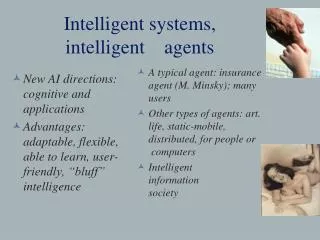
IntroductionEffects of the demographic shift 4.5 50 Support Ratio 1 UK Long TermHealthcare Cost 2 45 4.0 40 35 3.5 UK Long Term Healthcare Cost (£B) Ratio Persons Aged 16-64 to 65+ 30 3.0 25 20 2.5 15 2.0 10 1995 2005 2015 2025 2035 2045 2055 Year 1. Office for National Statistics, 2002.2. Royal Commission Report into Long Term Care, 1999.
Introduction • Intelligent Telecare provides new ways of enabling elderly or vulnerable people to maintain their independence and live in their own homes for longer. • BT is leading a DTI sponsored group of academic partners to develop an Intelligent monitoring system for telecare. • System uses a range of low cost sensors placed in the home to monitor a person's activity and build up a picture of their behaviour. • Target users are care professionals within social services (initially at Liverpool).
DTI/BT Funded Centre for Care in the Community Three Research Teams • Domain Specific Modelling • Sensor Network • Intelligent Data Analysis
Identifying the activities to monitor • Older population split into ‘priority groups’ identified by the DoH • Relevant activities identified for each priority group • A core set of activities relevant to physical, mental and social elements of well-being has been identified • Specific questions for each activity have been identified
Leaving & returning home (Social interaction) Visitors (Social interaction) Preparing food & eating appropriately (*ADL’s) Sleeping (*ADL’s) Leisure activities (Personal goals) Personal appearance (Personal goals) Core activity monitoring set for the physically frail priority group *Activities of Daily Living
Master bedroom Client home Kitchen sink drainer Double bed Back door Wardrobes Gas Oven/hob Bath Basin Fridge/ freezer Landing RMU Bathroom cupboard Lounge W.C. Coffee table Spare bedroom Draws ‘Radio’ chair Fireplace Pile of various objects Wardrobes ‘TV’’ chair Sofa & armchairs TV Window sill
Intelligent Data AnalysisConverting sensor data into Activity information
Domain Knowledge Data from a Sensor Network Target Group Well-being concepts Sleep monitoring Visitor detection ……. System Overview Provide Answers to Core Activity Questions
The Challenge • People are different, fickle, unpredictable, and unlike physical systems that have known responses to external influences • The challenge is to provide a system that can adapt to changes • These characteristics are very important in well-being monitoring, more so than e.g. consumer behaviour analysis • Cause No Harm! • Our Approach: Assist the carer in decision making by providing an easy-to-configure system that hides the complexity of the analysis
User Interface Sensor Object Management Interface to Sensor Network Report Generator Sensor Information AnalysisAlgorithms Pre-Processed Data Report Data Raw Data Pre-processing System Overview
Raw Data: • Contains logical inconsistencies • Subject to intermittent errors • Huge amount of events captured • Decision making needs abstract data: • when, where and what
User Interface Sensor Object Management Report Generator Sensor Information AnalysisAlgorithms Pre-Processed Data Report Data Raw Data Pre-processing Interface to Sensor Network Pre-processing Level - I • Grouping of similar events into blocks • Categorising sensors into location and activity types • Capturing additional sensor information e.g. activity levels, silence • Abnormal toggle sensor detection • Sensor location consistency check
User Interface Sensor Object Management Report Generator Sensor Information AnalysisAlgorithms Pre-Processed Data Report Data Raw Data Pre-processing Interface to Sensor Network Pre-processing Level - II • Using Fuzzy values for start time and duration of sensor event blocks • Converts time axis into a more meaningful and manageable number of regions • Allows reasoning with Fuzzy rules • Duration membership functions are learnt for each sensor and each client Bed Occupancy Kitchen Occupancy
User Interface Sensor Object Management Report Generator Sensor Information AnalysisAlgorithms Pre-Processed Data Report Data Raw Data Pre-processing Interface to Sensor Network Analysis Techniques • Provide answers to core activity questions • Abstraction of sensor events into daily activities • Identify key points in the data sequence (e.g. data silences) • Analyse surrounding sensor data to classify activities (e.g. bed in use - asleep) • Trend analysis
Activity Specific Analysis • Visitor Activity: • Challenge: No identification sensors (non-intrusive sensing) • To infer the existence of visitors: • Various metrics are used to describe regions of activity • Activity Levels • Delay in activity level changes • Non-adjacent rooms activity • Regions between entrance events are then compared • Changes are used to accumulate evidence of visitor activity
Region B clearly has a higher rate of activity • Sliding a window W across region B shows that the change in activity level occurs at the beginning of region B Visitor Activity • Use of Activity Levels for visitor evidence accumulation: • Average level of activity between door events • The delay after a door event before behaviours show change
All Room Changes Non-Adjacent Changes Non-Adjacent Bursts Visitor Activity • A Changing Rooms measure comprises: • The rate at which the location of activity changes • The proportion of changes between non-adjacent rooms • The longest sequence of consecutive non-adjacent changes • Fuzzy rules are used to accumulate the evidence of a visit
Visitor Activity Negative and Positive Changes Combined Sets (Equal Data Share) Q3 Q1 Q3 Q1 Q3 Q1 Q3 Q1 Big Fall Fall Steady Rise Big Rise A B C D E F A C D E F -1 0 0 1 -1 1 Act. Level Change Act. Level Change Activity Level Change Initial Sets (Equally Sized) Final Sets (Averaged) Big Fall Fall Steady Rise Big Rise Big Fall Fall Steady Rise Big Rise -1 1 -1 1 Activity Level Change Activity Level Change Training to obtain fuzzy membership functions • At each door event in the training set the changes in activity level are recorded • The results are split into ordered negative and positive changes • Each half is split into three, using their 1st & 3rd quartiles to define fuzzy sets • The fuzzy sets of each half are combined, then averaged with initial sets
Visitor Activity • Important Notes: • Data splits are {A: 40%, B: 40%, C: 20%}, {D: 20%, E: 40%, F: 40%} • Equally sized sets are not sensitive to an individual’s data spread • Sets using equal data can be over-sensitive when data spread is uneven • Averaged sets used are a compromise, avoiding both problems • The same style of training is applied to the changing rooms measure
Deployment DB Thin client SQL High Level Application objects over HTTP App. Server Client - Web browser based - Thin client - Multi-user - Pure HTTP/HTTPS communication Back End - Extensive calculation on server - SQL database driven