Download
1 / 8
80 likes | 189 Views
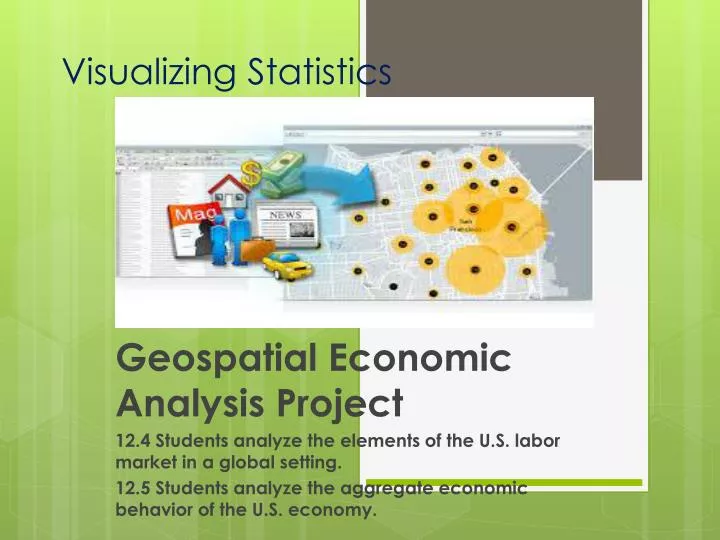
Visualizing Statistics. Geospatial Economic Analysis Project 12.4 Students analyze the elements of the U.S. labor market in a global setting. 12.5 Students analyze the aggregate economic behavior of the U.S. economy. . Project Process.

E N D
Visualizing Statistics Geospatial Economic Analysis Project 12.4 Students analyze the elements of the U.S. labor market in a global setting. 12.5 Students analyze the aggregate economic behavior of the U.S. economy.
Project Process • Students will do a brief quick write to determine focus of their project. • They will respond to the following prompt. Outline your economic outlook relating to the areas of education, cost of living, employment.
Goals • Students will gather statistical data from reliable sources (census, BLS, esri). • Students will be able to navigate and use the basic functions of ArcGIS Online (map notes, available layers, etc.). • Students will create a basic map that cleanly and accurately visually represents their statistical data.
Research Component • Students will need to collect information for each of the threes parts of their project. • 1.)Students research the college/post k12 enrichment program and determine location, cost and educational focus (major). • 2.) Students will find information in an article or academic paper about the cost of living in their chosen geographical area. • 3.) Students will use data from Bureau of Labor Statistics to find statistical data for their chosen career field.
Major Sources Onetonline.org Collegecost.ed.gov CNN Money Forbes The New York Times The Economist ArcGIS Online • bls.gov • census.gov
Guidelines Format Map Contents Must have data represented using a map layer or map note. Layers an notes must clearly represent the specific data from their research. Students must include 2 layers,2 notes, and one map note line or path. In addition their maps will demonstrate their individual interests by including two non economic map additions. • Students will correctly place geographic points and other map notations. • Students will represent data clearly and neatly. • Students will be able to present their map and the core of their research in 5 minutes to class in clear and concise manner.
Geospatial Economic Analysis Questions • What is the basic geographical economic environment that surrounds your post high school enrichment (college/military/career training)? • What is the geographical economic environment that surrounds your choice in career? • Based on your choice for post high school enrichment (college/military/career training) how has geography influenced that choice. What are the geographic benefits and barriers associated with your choice? • Considering your chosen career path how does geography impact the opportunities and pay for that chosen career. What are the possible geographic benefits and barriers associated with your choice?
Cumulative Discussion Questions • What went well? • What difficulties did we encounter? • What might we do different next time? • What value did you get out of completing this project other than a grade?