Download
1 / 17
170 likes | 313 Views
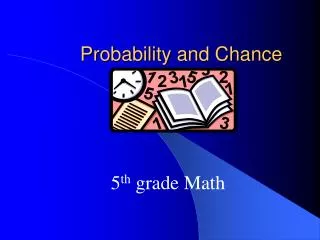
Probability and Chance. Mrs. Escamilla 5 th grade Math. Probability. Probability is a measure of how likely it is for an event to happen. We name a probability with a number from 0 to 1. If an event is certain to happen, then the probability of the event is 1.

E N D
Probability and Chance Mrs. Escamilla 5th grade Math
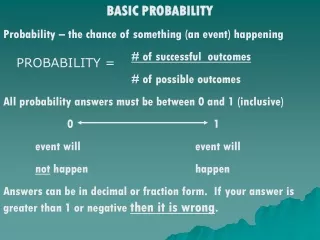
Probability • Probability is a measure of how likely it is for an event to happen. • We name a probability with a number from 0 to 1. • If an event is certain to happen, then the probability of the event is 1. • If an event is certain not to happen, then the probability of the event is 0.
Probability • If it is uncertain whether or not an event will happen, then its probability is some fraction between 0 and 1 (or a fraction converted to a decimal number).
1. What is the probability that the spinner will stop on part A? B A C D • What is the probability that the spinner will stop on • An even number? • An odd number? 3 1 2 A 3. What fraction names the probability that the spinner will stop in the area marked A? C B
Probability Fishing game! • Click to play BBC Education-Maths File-Fish Tank
It’s Probably Time For M&M’s !! • Testable Question: Which color is most likely to be picked at random from a bag of M&M’s? • Hypothesis: • Take one bag of M&M's. • Count the total number in the bag. • Separate the M&M's into each color.
Collecting Data • You should have a red, yellow, orange, green, blue, and brown pile. Count how many M&M's are in each pile. • Remember to organize your data in a table. • Which color has the largest quantity? Which color has the smallest quantity? Is this what you expected to find? Why or why not? CALCULATE THE MEDIAN, MODE, AND RANGE OF THESE NUMBERS
Collecting & Analyzing DataCreating Data Tables • Calculate the probability of picking a certain color of M&M for each color category. • The probability is found by creating a fraction, The number of M&M's in a color is placed in the numerator, the total number of M&M's is placed in the denominator. • Example: If there are 6 red M&M's and 54 total M&M's. The probability of picking a red M&M is 6/54. • Remember the more likely something is, the closer to 1 the probability will be. • What color is most likely? Which one is least likely? Are there any that are equally likely? (This means the probabilities are the same.)
What if you had…. • Look at the fraction for blue. What is the probability you would find a blue M&M in a handful of, say, 10 total M&Ms? 20? 30? • Consider this for each color. Include in your notes the probability for each color using the numbers above.
Display Your Results • Create a bar graph reflecting your findings. • Make sure to label each axis & give it a title
Pull It All Together • On a large sheet of paper, display the following: • Data table showing the number of each color that you had (Headings: color/amount) • Bar Graph • Table showing the probability of drawing each color at random from the bag (fraction form) • Expected probability with different amounts of M&Ms • Median, mode and range of your data
Written Assignment • Write a one page paper describing the process you went though, your findings, and reflections on those findings. • INCLUDE THE FOLLOWING: • Discuss the procedure you followed, and your findings for each color. • Describe any similarities and differences between the probabilities. • Describe which color is most likely to be picked at random, and which color is least likely. (“closer to one”) Justify why you think this. • What questions do you have that you would like to investigate further? • How would you do this experiment differently?
Probability Questions • Lawrence is the captain of his track team. The team is deciding on a color and all eight members wrote their choice down on equal size cards. If Lawrence picks one card at random, what is the probability that he will pick blue? blue blue green black yellow blue black red
CHANCE • Chance is how likely it is that something will happen. To state a chance, we use a percent. ½ Probability 0 1 Equally likely to happen or not to happen Certain to happen Certain not to happen Chance 50 % 0% 100%
Chance • When a meteorologist states that the chance of rain is 50%, the meteorologist is saying that it is equally likely to rain or not to rain. If the chance of rain rises to 80%, it is more likely to rain. If the chance drops to 20%, then it may rain, but it probably will not rain.
Donald is rolling a number cube labeled 1 to 6. Which of the following is LEAST LIKELY? • an even number • an odd number • a number greater than 5
1 2 1. What is the chance of spinning a number greater than 1? 4 3 • What is the chance of spinning a 4? • What is the chance that the spinner will stop on an odd number? 4 1 2 3 5 4. What is the chance of rolling an even number with one toss of on number cube?