Download
1 / 11
110 likes | 319 Views
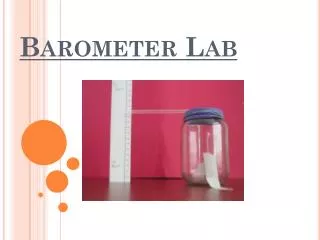
Barometer Lab. By: Irene Cordova, Sebastian Mantilla, Estefania Alvarez, Eduardo Villaquiran In this lab, you will build and use your own barometer to measure air pressure. . Problem. Write down a question that is clear and testable.

E N D
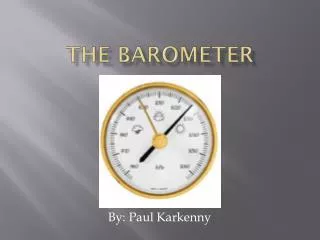
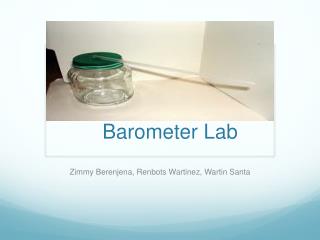
Barometer Lab By: Irene Cordova, Sebastian Mantilla, EstefaniaAlvarez, Eduardo Villaquiran In this lab, you will build and use your own barometer to measure air pressure.
Problem • Write down a question that is clear and testable. • At what temperature, average time does the pressure increase or decrease?
Background • 1. A • 2. B • 3. B • 4. A • 5. Lesser than B • 6. three properties are • Air consist of atoms and molecules. • Air has mass. • Has other properties such as density and pressure. • 7. it wont crush objects because the molecules in air move in all directions, not just one. • 8. the two units used in weather reports are: • Inches of mercury • Milibars
9. building vocabulary. • - air preassure= C • -altitude= F • -aneroid barometer= G • -barometer= D • -mercury barometer= E • -Preassure= B
Variables, Hypothesis HypothesisIf the temperature is high then there it will be less pressure because pressure depends on temperature and density. VariablesThe air pressure in the independent variable and the temperature is the dependent variable. In other words, the air pressure changes depending on the temperature and climate of the air. One controlled variable is the days in which we took the temperature and the time.
Data Collection Date Direction of needle Air pressure Barometric reassure My prediction Actual weather 16th Up-downLow4.1-4.0Sunny- cold19 C- 12 C 17th Up-downhigh 5.8-4.2Cold- Cold19 C-11 C 18th Up-downhigh5.7-4.3Raining-Warm20 C- 14 C 19th Down-uphigh5.9-4.4Warm- Warm13 C -12 C 20th Up-down Low 4.0-4.9Freezing-cloudy16 C- 12 C 21stUp-down Low 3.4-3.0Hot-warm18 C- 4 C 22ndUp-down Low 4.0-5.5Cloudy- freezing17 C- 10 C
Data Analysis1. Graph your results using the independent variable and the dependent variable.
2. From the graph, what can you conclude about changes in air pressure? This graph shows me that air pressure is very variable and changes thro the day very easily. The pressure in am is almost all the time higher than in the afternoon. The pressure in pm is lower than in am almost al the time we recorded the info. That is what I can conclude. 3. How many data points were you able to collect? Do you think this enough to conclusions about air pressure and weather changes? We collected 12 data point in are data table. I think we need more data points because it is a very short time to determine air pressure in a place fore as might be good if we can get a 30 data points. 4. Why was it important to record observations about the weather conditions? So we can know how the day was if it was hot could and to know the conditions we were doing are data collection fore are project. 5. Was your data reliable? Explain why or why not. Yes it was reliable because we did a good barometer and had a good data collection and did it with lots of effort.
6. Was your data accurate? Explain why or why not. (1 mark) • Our data was very accurate. First everything that was recorded was recrded with time and patience so the accuracy would be good and not bad. It took 7 days to record our data completely and we recorded our data very accurately and compared it with other dat just in case we where wrong. That is why our data was accurate.7. What change in atmospheric conditions must occur to cause the free end of the straw to rise? What change must occur for it to fall? (2 marks)Atmospheric conditions must be more condense and compresed within the jar. It would need to have a higher altitude more pressure and higher climatic changes for it to go up. To go down you need all the contrary, it needs less air pressure, less temperature, less compretion etc.8. According to your observations, what kind of weather is usually associated with high air pressure? With low air pressure? (2 marks)According to the observations higher temperature such as hot tempetures makes the air pressure decrease. When there is cold weather and low temper air pressure increases.
9. If your balloon had a tiny hole in it, what would happen to the accuracy of your barometer? (1 mark)All the lab and data recording will be completely screwed because air will not be compressed and the experiment will completely fail. Because air will be floting everywhere and you wouldn’t have anywhere to contain it.10. What effect, if any, would a great temperature change have on the accuracy of your barometer? Explain. (1 mark) • The change in temperturecan completely change the accuracy. First because the higher the temperature the lower the pressure it happens the same with low temperature, low temperature higher pressure. So if the temperature has a drastic change the data collection would change completely as well as the accuracy
Conclusion Our hypothesis did not support our results because we said that when the pressure is low, temperature will be high or vice versa. For example in one of our results there was a high temperature with a 20°C and pressure was high too. Another one is less temperature with 19°C and pressure was low too so our results didn’t support our hypothesis. Maybe a source of error that we did was that we didn’t take the temperature in order to have it correctly. Also that it was kind of difficult to use the barometer so maybe the pressure is not correctly too. In order to reduce these errors, we should do again the barometer and be careful while taking temperature and pressure. In conclusion since our hypothesis didn’t support our results, for next time we should have another prediction and be careful while taking temperature and pressure.