Download
1 / 11
140 likes | 671 Views
Worldwide market for railway infrastructure UNIFE Study Key Findings & Outlook 2016. EFRTC General Assembly Brussels, 28 November 2008. 1. The world market for rail infrastructure : status quo, trends and forecasts 2. Overall industry trends and impact on the rail infrastructure market.

E N D
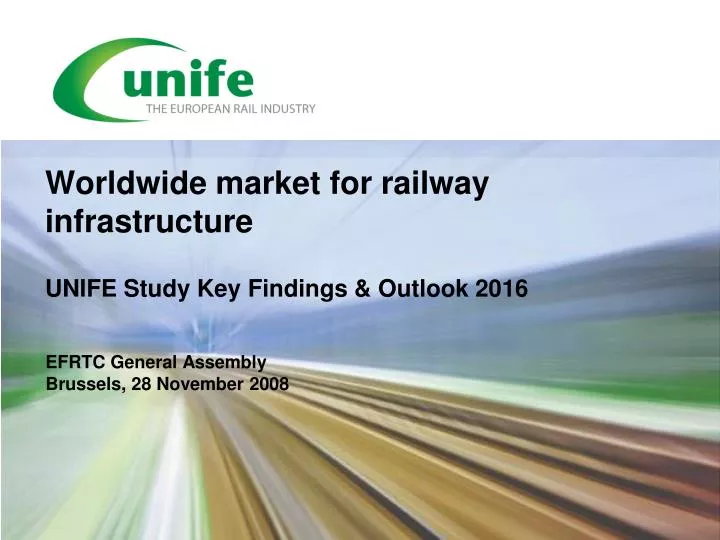
Worldwide market for railway infrastructureUNIFE Study Key Findings & Outlook 2016 EFRTC General Assembly Brussels, 28 November 2008
1. The world market for rail infrastructure : status quo, trends and forecasts 2. Overall industry trends and impact on the rail infrastructure market Agenda
17 Total rail supply market volume exceeds EUR 120 bn, infrastructure EUR 22 bn Key data Worldwide Rail Market Study TOTAL MARKET ACCESSIBLE MARKET2) Average market volumes 05-07 Growth p.a. Average market volumes 05-07 Growth p.a. 1231) 2.0-2.5% Rail control 3.0-3.5% Infrastructure 2.5-3.0% 861) 2.5-3.0% Rail control 3.0-3.5% Infrastructure 2.5-3.0% Rolling stock 37 2.0-2.5% Rolling stock 31 2.0-2.5% Services 53 2.0-2.5% Services 27 3.5-4.0% 1) Figures are including market volume for project integration, Growth rates are 9-year average growth rates 2) ACCESSIBLE MARKET: Part of the market open to any external supplier 3) Infrastructure segment includes rail, sleepers, ballast, ballastless, catenary, traction power supply
35% of the rail market volume originates from Western Europe Accessible market volume rail market [EUR m] – average 05-071) Infra-structure Rolling stock Rail control Services REGIONS [%] Western Europe Other 6,307 10,718 4,641 7,651 29,317 Western Europe 20 35 Eastern Europe 0,986 1,615 0,587 1,709 4,897 21 Asia/ Pacific CIS 0,639 2,500 0,421 2,004 5,564 24 NAFTA NAFTA 5,702 5,260 1,098 8,739 20,799 Rail Control Rolling Stock Rest of America 11 0,238 0,787 0,187 1,508 2,720 Infra- structure 37 20 Asia/Pacific 2,652 8,335 2,217 4,976 18,180 32 Africa/Middle East Services 0,570 2,090 0,502 0,349 3,511 SEGMENTS [%] 17,094 31,305 9,653 26,936 84,988 1) Excluding market volume for project integration
Facts and figures on the rail infrastructure market VHS, mainline, freight • 1.5 million km of passenger and freight infrastructure installed worldwide, 75% of which located in NAFTA, Asia/Pacific and Western Europe • 69% of world’s rail infrastructure is mainline • half a million km of electrified track currently installed worldwide • 1/3 in Western Europe where half of all track km are already electrified • NAFTA represents only 1% of world electrified infrastructure Urban rail • 70% of world’s 56,000 km of urban track are dedicated to light rail operation • Metro infrastructure gaining share in Asia/Pacific and Western Europe, light rail infrastructure mainly in CIS and Eastern Europe
Expected growth per product category ranges from 2% to 4% Annual growth rates accessible market volume 2007-2016 [% p.a.] Infrastructure • Rolling Stock • Rail control • Services Above average growth foreseen for electrification in the mainline segment • High growth ex-pected for (V)HS trains, intercity multiple units and light rail vehicles – slight decline in demand for coaches • Significant growth foreseen for ETCS (within and outside of Europe) and CBTC systems • Solid, global development and increasing accessibility expected, also due to increasing rolling stock base 2.5% – 3.0% • 2.0% – 2.5% • 3.0 – 3.5% • 3.5% – 4.0%
Regional growth focus - mainline Annual growth rates, accessible market, superstructure and electrification, VHS/ mainline, 2007-2016 [%] • Rest of America and NAFTA to enter VHS market in next few years • Negative growth rate for Eastern Europe to be explained by Turkish important orders in 05-07
Regional growth focus – urban rail Annual growth rates, accessible market, superstructure and electrification, urban rail, 2007-2016 [%] • in the LT, need for mass transport systems in growing metropolitan areas (Asia)
Short-term growth boosted by huge rolling stock and infrastructure projects Short-term (2008-2010) and long-term annual growth rates of annual market volume for rolling stock and infrastructure (EUR bn)
Overall trends favor the industry's development Selection of relevant major trends Urbanisation • results in additional • and lasting demand for public rail transport, esp. in emerging megacities and metropolitan areas • Ecological awareness & energy consumption • favour rail as an environ- • mentally friendly transport mode • Leasing & • Financing • facilitates operators' demand and generates additional demand through inter-nationalisation of leasing companies ERTMS • opens European markets and creates additional demand from implementation outside of Europe Deregulation and liberalisation • higher competition for rail operation increases demand for new rolling stock • Shortage of engi- • neering capacity • may become the bottleneck for growth Indicates impact on the industry
Providing Competitive Railway Systems for Increased Rail Traffic www.unife.org


![Market Outlook for Alcoholic Beverages (Distilled Spirits) in India [2016-2021]](https://cdn4.slideserve.com/7275858/slide1-dt.jpg)
![Market Outlook for Alcoholic Beverages (Distilled Spirits) in India [2016-2021]](https://cdn4.slideserve.com/7275863/slide1-dt.jpg)