Download
1 / 6
110 likes | 234 Views
Line Graph. A graph that connects points to show how information changes over time. GLE 0406.5.1 0406.5.2 SPI 0406.5.1. Parts of a Line Graph. Vertical or y-axis. 15 10 5 0. points. Value for the vertical or y-axis.

E N D
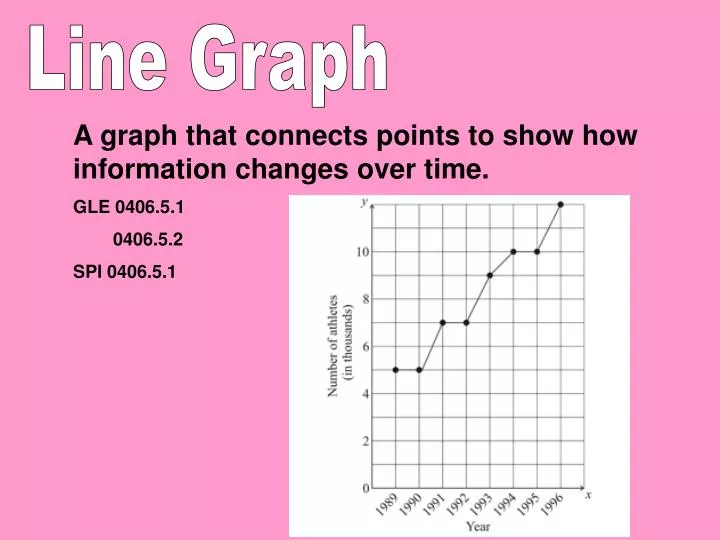
Line Graph A graph that connects points to show how information changes over time. GLE 0406.5.1 0406.5.2 SPI 0406.5.1
Parts of a Line Graph Verticalor y-axis 15 10 5 0 points Value for the vertical or y-axis Connecting line Horizontal or x-axis 2 4 6 8 Value for the horizontal or x-axis
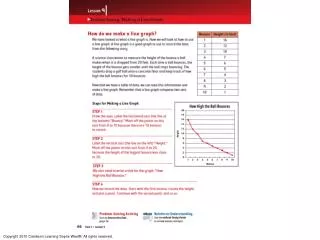
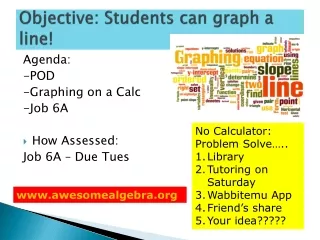
How to Make a Line Graph • Gather data. Line graphs will show specific changes in data. The data must have two comparable variables to use a line graph. • Label the horizontal or x-axis with the independent variable. This is the variable that can change. • Label the vertical or y-axis with the dependent variable This is the variable that won’t change. • Label each axis with a value and begin plotting your data. Draw a connecting line between each point.
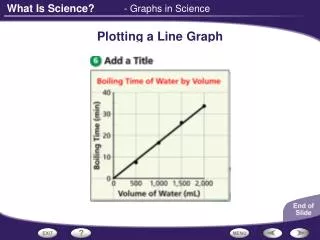
Activity Example 1. Gather your data. For this example, data has been gathered about the average rainfall in TN. Degrees in Fahrenheit
2. Draw a right angle and label the horizontal and vertical axis. 5.15.04.94.84.74.64.54.44.34.24.14.03.93.83.73.63.53.43.23.13.02.92.82.72.6 Average amount of rainfall in inches for each month in Knoxville, TN Jan. Feb. Mar. Apr. May June July Aug. Sept. Oct. Nov. Dec. Months of the year
Additional Activities http://www.mathgoodies.com/lessons/graphs/line.html http://nces.ed.gov/NCESKIDS/GRAPHING/classic/line.asp http://www.ixl.com/math/practice/grade-4-line-graphs