Download
1 / 28
420 likes | 935 Views
Mathematical models of infectious diseases. D. Gurarie. Lecture outline. Goals Methodology Basic SIR and SEIR BRN: its meaning and implications Control strategies: treatment, vaccination/culling, quarantine Multiple-hosts: zoonotics and vector-born diseases.

E N D
Mathematical models of infectious diseases D. Gurarie
Lecture outline • Goals • Methodology • Basic SIR and SEIR • BRN: its meaning and implications • Control strategies: treatment, vaccination/culling, quarantine • Multiple-hosts: zoonotics and vector-born diseases
1. Math modeling: issues, problems • Spread of diseases in populations • Biological factors (host-parasite interactions) • Environmental – behavioral factors (‘transmission environment’) • Public health assessment (morbidity, mortality) • Intervention and control • Drug treatment (symptomatic, prophylactic) • Vaccines • Transmission prevention • Modeling Goals • Develop mathematical/computer techniques, tools, • methodology to • Predict outcomes • Analyze, develop control strategies
2. Early history of math. modeling (XVIII century smallpox) • Known facts: • Short duration (10 days), high mortality (up to 75%) • Life-long immunity for survivors • Possible prevention: inoculation by cow-pox • Q: could life expectancy be increased by preventive inoculation? • Approach: age-structured model of transmission + ‘analysis’ => • Answer: gain of 2.5 years Daniel Bernoulli 1700-1782
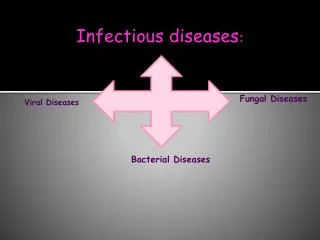
3. Transmission patterns Direct: host – to-host (flu, smallpox, STD,…) Vector –borne diseases schisto malaria 3. Epizootic: WNV, Marburg, …
4. Infection patterns: typical flu outbreak Data (British Medical Journal, March 4 1978, p. 587) Explain outbreak pattern ? Predict (peak, duration, cumulative incidence) ? Control (drug, vaccine, quarantine) ?
5. SIR –methodology: host ‘disease states’ and history S – Susceptible E – Exposed I – Infectious R - Removed /immune R I E S Latency Infective stage Immune stage …
6. SIR transmission in randomly mixing community • Community of N hosts, meet in random groups of c (or less) = contact rate • Host states and transitions: S I R • Probability of infection/infectious contact = 1-p • Recovery rate = 1-r (=> mean duration of I-state T=1/(1-r)) • Life long immunity Day 1 2 3 … Groups {1},{2,9,13},{4,5,10},{6,7,8}
Simulated pattern: infection outbreak Questions • Outbreak duration, peak -? • Cumulative incidence (other health statistics)-? • Dependence on c (contact), p (transmissibility), r (recovery) - ? • Control, prevention ?? • Drug treatment • Vaccine • Quarantine
II. SIR methodology: diagrams S I Birth Death S I R SIR recruitment SEIR SEIR S S E E I I R R V V SI Variables: S, E, I, R, V (vaccinated) – host states, or populations /fractions Loss • Continuous (DE) for {S(t),… }- functions of time t • Discrete {S(t),… } (t=0,1,2,…) • Community level (populations) • Individual level (agent based) Models:
Discrete SIR: Reed-Frost • S+I+R=N (or S+E+I+R=N) - populations, or prevalences: S+E+I+R=1 • Parameters: • c - contact rate (‘average # contacts’/host/day) • p – probability to ‘survive infectious contact’ (1-p = susceptibility) • l(p,c) – force of infection • q – probability to stay latent => latency duration =1/(1-q) - ?? • r –probability to stay infected => infectious period=1/(1-r) • s –probability to stay immune => immune duration=1/(1-s) l S I l 1-q S E I 1-r 1-r 1-s 1-s R R
Reed-Frost map (discrete time step) “current state” “next state” • (S,I,R) (S’,I’,R’) (S,E,I,R) (S’,E’,I’,R’) • (S=S(t),… ) (S’= S(t+1),…) Equations: No analytic solution!
Smallpox SIR Flu
Numeric simulations Smallpox Flu SIR SEIR
Analysis of outbreaks and endemic equilibria 3 basic parameters Susceptibility :1-p (‘resistance to infection’ = p) Contact rate: c recovery rate: r Questions: 1. How (p,c,r) would determine infection pattern: outbreak, endemic equilibria levels et al? Control intervention -?
Key index: BRN R0 > 1 – stable endemic infection (flu); outbreak of increased strength (smallpox) R0 < 1 – stable eradication (flu); no outbreaks (smallpox) • Control, prevention • Drug treatment r (“prophylactic MDT“-> p) • Vaccine ‘S- fraction’, p • Quarantine c
1. Effect of vaccine 0<f<1 – cover fraction e>1 – efficacy (enhanced resistance): (normal) p(vaccinated) pV = p1/e 1. Perfect vaccine (1/e = 0 – full resistance) Vaccination = Effective reduction of contact rate: c (1-f)c Reduced BRN f S E I R V If R0 is known (?), cover fraction f=1-1/R0 needed to eradicate infection.
2. Imperfect vaccine (1/e>0) 0<f<1 – cover fraction e>1 - efficacy 1-f • Effects of vaccine: • reduce risk of infection under identical ‘infected contacts’: p pV = p1/e > p • enhance recovery: r rV = re <r S’ S E’ E I’ I R f • Effect (f,e) - ? • BRN: R0(f,e) -? • Can BRN be brought <1 ?
III. Continuous (DE) models r r l=bI l=bI a S E S I I R R r r Differential equations Parameters
2. Smallpox SIR (immune loss r=0) Phase-plane S Time series Cumulative incidence I 1/R0 BRN:
3. SIR with immune loss (flu) Endemic Equilibrium • BRN r – recovery d –disease mortality r – immune loss Prevalence DE Analysis:
4. BRN: meaning, implications • (SIR with life-long immunity): R0 determines whether outbreak occurs (R0 >1), or infection dies out (R0 <1) • BRN is related to initial infection growth : As , R0 approximately measures “# secondary cases/per single infected” over “time range ” r t=1 • BRN (R0 >1) determines infection peak and timing, depending on initial state I0 • For SIR with immune loss sets apart: (i) endemic equilibrium state (R0 >1), or waning of infection (R0 <1)
5. Control intervention • Vaccination (herd immunity): • vaccinating fraction f of susceptibles decreases R0 (1-f)R0. So f>1-1/R0 prevents outbreak • culling of infected animals has the same effect I(1-f)I • Demographics: • increased population density N drives R0 = bN/r up (enhanced outbreaks, higher endemicity) • Transmission prevention: • Lower transmission rate b decreases R0
IV. Vector mediated transmission Viral: RVF, Dengue, Yellow fever, Plasmodia: Malaria, toxoplasma Parasitic worms: schistosomiasis, Filariasis
X X Y Z Z R R v u w w u 2. Coupled SIR-SEIR diagrams Host: Vector:
3. Macro-parasites: schistosome life cycle This diagram is provided by Center for Disease Control and Prevention (CDC).
4. Macdonald model: mean intensity-burden (host) + prevalence (vector) Infection intensity (burden) is important for macro-parasites w=mean worm burden of H population; y=prevalence of shedding snail; • Premises: • Steady snail population and environment • Homogeneous human population, and transmission patterns (contact /contamination rates, worm establishment ets) BRN: => equilibria, analysis and control (??)
Summary (math modeling) • Models either ‘physical’ (mice) or ‘virtual’ (math) allow one to recreate ‘reality’ (or part of it) for analysis, prediction, control experiment s • Methodology: • Models need not reproduce a real system (particularly, complex biological ones) in full detail. • The ‘model system’ is made of ‘most essential’ (in our view) components and processes • For multi-component systems we start with diagrams, then produce more detailed description (functions, equations, procedures) • Math models have typically many unknown/uncertain parameters that need to be calibrated (estimated) and validated with real data • Simple math. models can be studied by analytic means (pen and paper) to draw conclusions • Any serious modeling nowadays involves computation.