Download
1 / 22
220 likes | 320 Views
Electrical and Chemical Signals. Aim: Does the colour intensity of a drink affect how sweet it tastes?. Any Questions?. Method:. Collect cups, lemonade (of a known sucrose concentration), red food dye, stirring rod and a measuring cylinder.

E N D
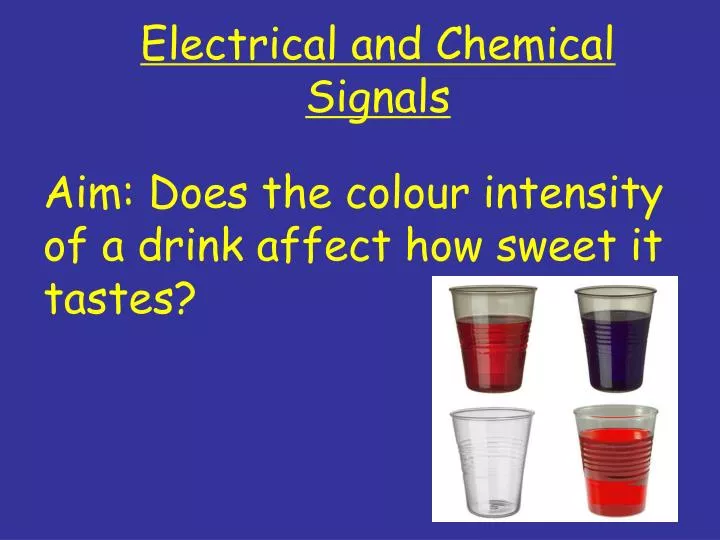
Electrical and Chemical Signals Aim: Does the colour intensity of a drink affect how sweet it tastes?
Method: • Collect cups, lemonade (of a known sucrose concentration), red food dye, stirring rod and a measuring cylinder. • Measure out 50ml of lemonade into a measuring cylinder. • Label the containers A-E. • Add 1 drop of red food colouring to cup A, 2 to cup B, 3 to cup C, 4 to cup D and 5 to cup E. • Stir the different lemonade/dye solutions to ensure an even distribution of food colouring. • Ensure that the person tasting the drink does not see the preparation of the drink.
Method Continued……. 7) Get the same person to try all of the drinks A-E, in between each drink they should rinse their mouth out with mineral water. Then they should put the drinks into the order of which one they think is sweetest (A-E). Collect the results in a table and repeat the experiment again with the same person 2 more times. Making sure that you use clean cups each time. Then get different people to do the same experiment and compare the different results. Ensure that no-one shares the same cup, cups are clean and that the equipment used has not been used for any other experiments.
How did you make your experiment reliable? • We repeated our experiment 3 times for each individual. • We ignored any odd results or repeated them. How did you make your experiment valid? • We used the same amount of lemonade each time (50ml) • We used the same lemonade each time (with the same amount of sucrose in it). • We washed our mouths out with water after each taste to get rid of any sugary taste • We used clean cups • We measured the amount of food dye used each time and used the same food dye each time • People should be in the same age range • Same brand of lemonade should be used • Only one colour of food dye is used as this could affect results • Try not to use other senses like smell as this could affect the results.
How would you carry out an investigation to investigate the effect of smell on taste?
Method (in your own words)……….. Collect cups, lemonade (of a known sucrose concentration), blindfold, sugar, stirring rod and a measuring cylinder. Measure out 50ml of lemonade into a measuring cylinder. Label the containers A-E. To each bottle add a different amount of sugar. Stir the different lemonade/sugar solutions to ensure an even distribution. Ensure that the person tasting the drink does not see the preparation of the drink. Blindfold a person. Get the person to smell a cup of one of the drinks, then taste it. Get the person to rank the drinks in order of sweetness.
One hundred volunteers were chosen to complete this task. The results are shown in the table. The remainder of the volunteers were unable to detect a difference in the sweetness of the drinks. • How many volunteers were unsure? 5 20
Transfer your results onto the table issued to you. • Put your name onto the table. • I will collect these in. • This table will be given to you during the IAA exam on Monday.
Look at the table of data 5 30 One hundred volunteers were chosen to identify flavours of drinks. The results are shown in the table.
Use the information from your graphs and scientific principles to help you explain why being able to see may have affected peoples sense of taste?
What does your investigation tell you about the senses of sight and taste?
How could you make an experiment looking at how sight affects taste, reliable and valid?
How could you make a future investigation more… • Reliable: • Test more people (repeat). • Valid: • Use a wider range of people (age, gender). • Use a placebo/ control to compare results to. • Control other senses. • Do under lab conditions.
What are the advantages and disadvantages of adding artificial food colourings to foods?
What are the advantages and disadvantages of adding artificial food colouring?