Download
1 / 1
10 likes | 124 Views
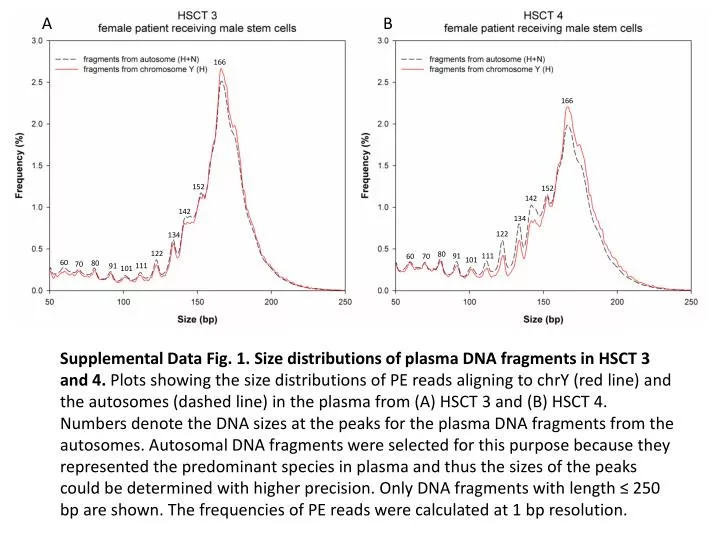
A. B. 166. 166. 152. 152. 142. 142. 134. 122. 134. 122. 80. 91. 111. 60. 70. 101. 60. 80. 70. 111. 91. 101.

E N D
A B 166 166 152 152 142 142 134 122 134 122 80 91 111 60 70 101 60 80 70 111 91 101 Supplemental Data Fig. 1. Size distributions of plasma DNA fragments in HSCT 3 and 4. Plots showing the size distributions of PE readsaligning to chrY (red line)and the autosomes(dashed line)in the plasma from (A) HSCT 3 and (B) HSCT 4. Numbers denote the DNA sizes at the peaks for the plasma DNA fragments from the autosomes. Autosomal DNA fragments were selected for this purpose because they represented the predominant species in plasma and thus the sizes of the peaks could be determined with higher precision. Only DNA fragments with length ≤ 250 bp are shown. The frequencies of PE reads were calculated at 1 bp resolution.