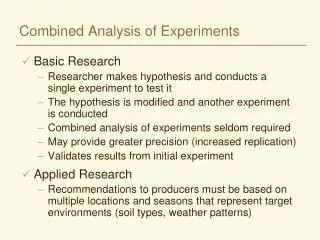
Download
1 / 22
220 likes | 303 Views
combined analysis of the spectrum and anisotropies of UHECRs. Daniel De Marco. Bartol Research Institute University of Delaware. plan. AGASA vs HiRes AGASA: spectrum vs ssa expectations for Auger. AGASA & HiRes. a factor 2 in the flux. HiRes: GZK AGASA: no GZK.

E N D
combined analysis of the spectrum and anisotropies of UHECRs Daniel De Marco Bartol Research Institute University of Delaware
plan AGASA vs HiRes AGASA: spectrum vs ssa expectations for Auger
AGASA & HiRes a factor 2 in the flux HiRes: GZK AGASA: no GZK
DDM, Blasi, Olinto 2003 systematic errors (?) AGASA +15%HiRes -15% agreement@ low energy less disagreement@ high energyhow much?
DDM, Stanev 2005 fit uncertainties fit to shifted data in the range 1019 eV to 1020 eV log102 proton propagation
DDM, Stanev 2005 fit uncertainties m=0, ±1
statistical error in the energy reconstruction <n20> forAGASA is increased by 1 energy resolution: ±30%
high energy: AGASA we simulated 30000 realizations of the AGASA statistics above 4·1019 eV (72 events) and we counted the number of events with energy above 1020 eV. 18 realizations produced 11 or more events above 1020 eVprobab.: 6·10-4 — 3.2 propagation simulation (=2.6) GZK suppression the same procedure applied to the AGASA-15% statistics resulted in a probability of about 1%—2.3 AGASA result (11) accounting for the sys. errors, the AGASA result doesn’t have a high statistical significance histogram of the number of events recorded with energy above 1020 eV DDM, Blasi, Olinto 2005
some AGASA spectra DDM, Blasi, Olinto 2005
high energy: HiRes we simulated 10000 realizations of the HiRes statistics above 4·1019 eV (27 events) and we counted the number of events with energy above 1020 eV. no propagation, we used as template the AGASA measured spectrum, but for the HiRes statistics 301 realizations produced 1 or less events above 1020 eVprob.: 3% — 2 histogram of the number of events recorded with energy above 1020 eV HiRes result (1) the HiRes result as well does not have a high statistical significance
Small Scale Anisotropies: what can they tell us? simulation of the propagation from astrophysical point sources
AGASA 2pcf point sources (?) DDM, Blasi, Olinto 2005 see also Finley and Westerhoff 2003
B~<10-10 G resol.=2.5º =2.6 m=0E > 4 1019 eV - 57 events 10-6 Mpc-3 10-5 Mpc-3 10-4 Mpc-3 AGASA multiplets DDM, Blasi 2004
sources characteristics LCR = 6 1044 erg/yr/Mpc3 (E>1019 eV - from spectrum fits) n0 = 10-5 Mpc-3(from ssa) Lsrc = 2 1042 erg/s (E>1019 eV) • are these ssa for real? • the significance of the AGASA result is not clear • HiRes doesn’t see them • some internal inconsistency
AGASA spectrumdiscrete sources P: 6 10-4 2 10-4 : 3.2 3.7 DDM, Blasi, Olinto 2005
arrival directions P~2 10-5 DDM, Blasi, Olinto 2005
both the ssa and the spectrum measurement need more statistics to beconclusive and reliable
Auger 2pcfE>4 1019 eV DDM, Blasi, Olinto 10-6 Mpc-3 10-5 Mpc-3 10-4 Mpc-310-3 Mpc-3 cont.
Auger2pcfE>1020 eV 10-6 Mpc-3 10-5 Mpc-3 10-4 Mpc-3 10-3 Mpc-3 cont. DDM, Blasi, Olinto
Auger spectrum DDM, Blasi, Olinto
conclusions • AGASA & HiRes: statistics too low to reach conclusions on spectrum & ssa • m & degeneracy: we need good composition measurements or other method to determine where the galcatic CRs end (ex: anisotropy) • Auger should be able to shed light on some of these issues