Download
1 / 2
20 likes | 133 Views
Fuel, Mileage and Miles Per Gallon (MPG) Computation. IE36. 1. From the SAP R/3 System Easy Access screen or from your favorites, enter or select transaction code IE36 . 2. Click or press Enter . The Display Vehicles: Vehicle Selection displays.

E N D
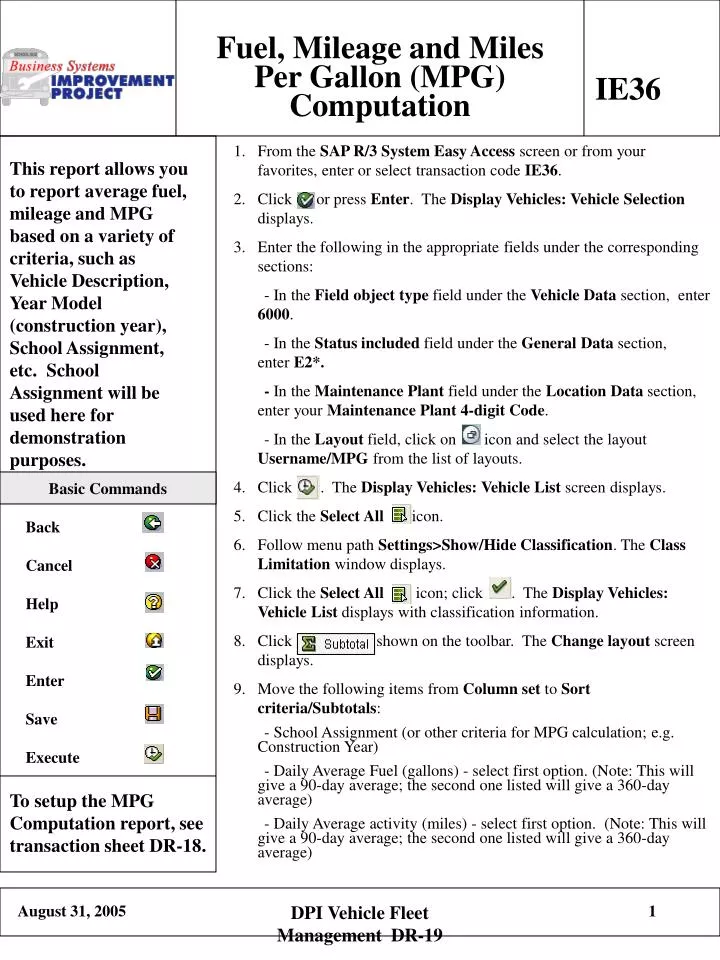
Fuel, Mileage and Miles Per Gallon (MPG) Computation IE36 1. From the SAP R/3 System Easy Access screen or from your favorites, enter or select transaction code IE36. 2. Click or press Enter. The Display Vehicles: Vehicle Selection displays. 3. Enter the following in the appropriate fields under the corresponding sections: - In the Field object type field under the Vehicle Data section, enter 6000. - In the Status included field under the General Data section, enter E2*. - In the Maintenance Plant field under the Location Data section, enter your Maintenance Plant 4-digit Code. - In the Layout field, click on icon and select the layout Username/MPG from the list of layouts. 4. Click . The Display Vehicles: Vehicle List screen displays. 5. Click the Select All icon. 6. Follow menu path Settings>Show/Hide Classification. The Class Limitation window displays. 7. Click the Select All icon; click . The Display Vehicles: Vehicle List displays with classification information. 8. Click shown on the toolbar. The Change layout screen displays. 9. Move the following items from Column set to Sort criteria/Subtotals: - School Assignment (or other criteria for MPG calculation; e.g. Construction Year) - Daily Average Fuel (gallons) - select first option. (Note: This will give a 90-day average; the second one listed will give a 360-day average) - Daily Average activity (miles) - select first option. (Note: This will give a 90-day average; the second one listed will give a 360-day average) This report allows you to report average fuel, mileage and MPG based on a variety of criteria, such as Vehicle Description, Year Model (construction year), School Assignment, etc. School Assignment will be used here for demonstration purposes. Basic Commands Back Cancel Help Exit Enter Save Execute To setup the MPG Computation report, see transaction sheet DR-18. DPI Vehicle Fleet Management DR-19
Fuel, Mileage and Miles Per Gallon (MPG) Computation IE36 10. Under Sort criteria/Subtotals, click Ascending sort button. 11. Select the checkbox beside School Assignment (or the criteria you are processing). Click . In our example using School Assignment, the report will display the daily average fuel (gallons) and the daily average activity(miles) totals for each School Assignment. Average consumption is not a numeric field and cannot be averaged. You can manually divide mileage by fuel to get the Miles Per Gallon. Report can be exported to Excel for further processing. This report allows you to report average fuel, mileage and MPG based on a variety of criteria, such as Vehicle Description, Year Model (construction year), School Assignment, etc. School Assignment will be used here for demonstration purposes. Basic Commands Back Cancel Help Exit Enter Save Execute To setup the MPG Computation report, see transaction sheet DR-18. DPI Vehicle Fleet Management DR-19