Download
1 / 17
170 likes | 465 Views
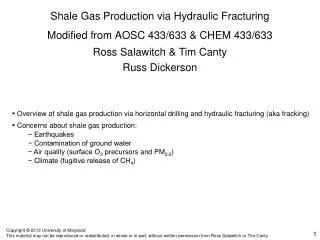
Water Quality and Hydraulic Fracturing: GIS Analysis. Kyra Reumann -Moore REU in Environmental Sustainability Mentor: Joe Ryan Graduate Student: Jessica Dehart. Background on Hydraulic Fracturing. Concern over spills, faulty casing, flawed cementing, or travel through faults

E N D
Water Quality and Hydraulic Fracturing: GIS Analysis Kyra Reumann-Moore REU in Environmental Sustainability Mentor: Joe Ryan Graduate Student: Jessica Dehart
Background on Hydraulic Fracturing • Concern over spills, faulty casing, flawed cementing, or travel through faults • Evidence of elevated methane within 1 km of producing wells in PA • Pavillion, WY study: elevated pH, BTEX, Cl–,K+ • COGA Voluntary Baseline Sampling Program • COGCC mandatory groundwater monitoring • Only state to require samples after drilling • One of three to require sampling at all
AirWaterGas SRN • 5 year NSF grant of $12 million • Awarded Fall 2012 • CU-Boulder is the lead institution • My area: Water Quality • Will fracturing fluidcontaminate drinking water aquifers? • Focus on the Denver- Julesburg basin • Look at: contamination levels, parameter correlations, oil and gas wells proximity
COGCC Database • Individual water well sample sites • Oil and gas wells shapefile • Looked at parameters based on EPA and CDPHE drinking water quality standards • 627 samples used in analysis • Problems: lack of coordinates, qualifier codes in data, parameters not reported consistently
COGCC Database The online database map A typical sample site page
As reported by the COGCC Wells in the DJ Basin Oil and Gas Wells in the DJ Basin Water Wells in the DJ Basin
Field Sampling • With Stephen Osborn and a team from Cal Poly Pomona • 39 sample sites in Boulder, Adams, and Weld counties • Helped Jessica Dehart take 6 samples at each site for DOC, VOCs, and pesticide analysis • Field data: latitude and longitude, pH, specific conductivity • Also sampled for future analysis: dissolved gases, isotopes, alkalinity, metals
Spatial Trends Methane and TDS concentrations
Field Data Locations Field and COGCC Conductivity
Methane Concentrations Near Wells My graph based on COGCC data Osborn’s graph from PA *Please note the difference in scale*
Carbon isotopes My graph based on COGCC data Osborn’s graph from PA Methane (mg/L) Delta 13C C1 (per mil)
Areas for Further Research • What geologic formations the water wells are in • Further study of carbon isotopes • Fault proximity • Time between oil and gas well activity and water well sampling • More field sampling, especially at COGCC sites with high concentrations
Acknowledgments • SRN – Air Water Gas Research Group • Dr. Joe Ryan • Jessica Dehart • Dr. Stephen Osborn • National Science Foundation • Dr. Lupita Montoya • COGCC • TestAmerica, Accutest, ALS Environmental