Download
1 / 21
220 likes | 409 Views
AMI project for Israel Electricity Corporation. Beeper- Larotech Ilan Friedland - CEO. Israel Electric Company - Background Information. Yearly income - 6.3B $ us Total no’ of consumers - 2.5 M Production capacity - 12,500 MW Electricity supplied ( sold ) - 57,145,000 MWh

E N D
AMI projectfor Israel Electricity Corporation Beeper-Larotech IlanFriedland - CEO
Israel Electric Company - Background Information • Yearly income - 6.3B $us • Total no’ of consumers - 2.5M • Production capacity - 12,500 MW • Electricity supplied (sold) - 57,145,000 MWh • Average Unavailabilityper consumer/year - 132 minutes(exceptionally low) * IEC 2011 statistical reports
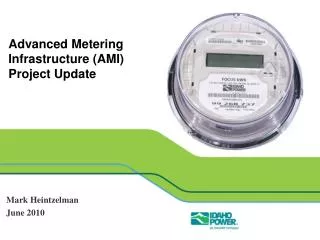
IEC AMI - Project Background • Israel Electric Corporation (IEC) decided to implement Smart Metering • Why smart metering? • Billing & Collection • Customer service Improvement • Demand Respond – peak shaving and production planning • Deployment in few stages • First stage : 8.5K Industrial customers(the largest AMI project in Israel) • Next stages: extend to 30K – 50K C&I
Israel Electric Company – Larotech AMI Project Annual KWh Supply – Breakdown by Customer Type AMIPhase II 60% of Annual Income 3.8B$)) AMIPhase I
Israel Electric Company - AMI Project ROI for AMI Project • 8,500 meters - 53% of total revenues • Large customers billing - ~250K $USper month • Project cost per year - 500 K $US • 2 faulty meter reading per month = AMI project cost per year • Customer service Improvement • Demand Respond – peak shaving and production planning
AMI - Typical Architecture • Objectives: • Meter reading & management by either Web2MTM system users or third party servers • Monitoring and control of the communication infrastructure • Main Larotec’s system components: • Interface & Communication Units (ICU) interfaced to the meters • Communication Server – management of meter reading, communicationand asset management • The Web2MTM is integrated with additional system components: • Metering server: Reads the meters via the ICU • Radius Server: Responsible for the network IP assignment • GIS Server: displaying end device (ICU + meter) location and status on maps
IEC AMI - Robust Architecture Industrial Meters Larotec’s ICU Fixed IP Comm. Server Private APN via GPRS Network Radius Server Metering Server reading success rate - 99.7%
Multiple operating modes • Transparent mode: • “Transparent Bridge” between 3rd party Metering Server and the system • Listening mode: • ICU waits for requests from the metering or communication servers while still performing its regular procedures • Command mode: • FOTA (firmware over the air) • Data on Demand • Configuration update
Additional features for IEC project • Communication Management • Monitoring: • Cell ID: trackingthe active cell serving the ICU • Rx level: tracking level of GPRS Radio Frequency signal reception • Commands: • Get Data Now: enabling data acquisition at any required time • Activation: remotely enable/disable meter reading services • Communication parameters: Configure parameters on the fly from remote location • Remote s/w update • Templates: pre-defined profile assigned to any hierarchical group via the communication server
Project Status - 2012 • 6,850 installations • Deployment – Nation Wide since 2010 • Meter Reading success – 99.7% • Data Collection Interval – 2 times per day • Meter Reading Interval – 15 min
Why 2/3G for Smart Grid - Technology Selection Consideration