Download
1 / 18
180 likes | 289 Views
ncBrowse: OPeNDAP Server Access and 3-D Graphics. Donald W. Denbo UW/JISAO-NOAA/PMEL. John R. Osborne OceanAtlas Software. Presented by Nancy N. Soreide NOAA/PMEL. http://www.epic.noaa.gov/java/ncBrowse. ncBrowse Overview.

E N D
ncBrowse: OPeNDAP Server Access and 3-D Graphics Donald W. DenboUW/JISAO-NOAA/PMEL John R. OsborneOceanAtlas Software Presented byNancy N. SoreideNOAA/PMEL http://www.epic.noaa.gov/java/ncBrowse
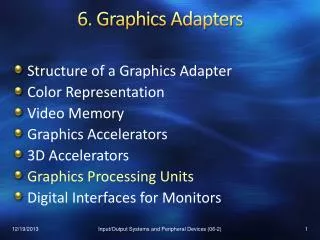
ncBrowse Overview • ncBrowse is a Java Application initially designed to graphically browse netCDF files. • Flexible, interactive graphical displays of data • Tree and table views of netCDF file schema • Publication quality printable graphics with science features such as contour plots, self-scaling time axes, etc. • Supports a wide range of netCDF conventions • COARDS – oceanic/atmospheric data sets (gridded) • EPIC – oceanic observations, profile and time series • Available for Windows, Unix, MAC OS • Popular! • ncBrowse has been downloaded over 8476 times to ~3528 unique sites in 59 countries. NOAAResearch WebShop 2003, Longmont, CO
ncBrowse Overview NOAAResearch WebShop 2003, Longmont, CO
ncBrowse, OPeNDAP and 3D graphics • ncBrowse can currently access OPeNDAP datasets that are compatible with the Java-netCDF API. • Providing access to OPeNDAP datasets with more complex data models than netCDF supports, while challenging, is currently in development. • ncBrowse has been significantly enhanced by providing 3-D visulaizations using the VisAD library. NOAAResearch WebShop 2003, Longmont, CO
OPeNDAP - Overview • OPeNDAP (previously DODS) is a software framework and protocol for providing and accessing scientific data over the internet. • Client software most frequently uses the netCDF API interface to OPeNDAP, thus minimizing the software modifications necessary. • The netCDF API cannot directly and/or transparently access more sophisticated OPeNDAP data types such as Structure and Sequence. NOAAResearch WebShop 2003, Longmont, CO
OPeNDAP - Goals • Provide ncBrowse users access to the growing collection of datasets available via OPeNDAP. • Access the dataset descriptor (DDS) and data attribute (DAS) structures. • Combine the DAS and DDS to provide easy access to variables and their metadata. • Provide an easy-to-use interface to the OPeNDAP Sequence and Structure objects. NOAAResearch WebShop 2003, Longmont, CO
OPeNDAP - Design NOAAResearch WebShop 2003, Longmont, CO
OPeNDAP Connection to “CHRIS” - wind stress from LDEONotice that the format of the data file is not important
Connection to Wind Stress from NOAAs Buoys from URIOPeNDAP structure reveals data is a JGOFS sequence
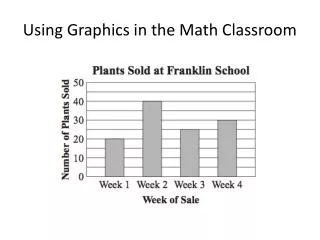
3D-Visualization - Overview • 3D visualizations are necessary to adequately browse certain classes of data. E.g., • Float trajectories are inherently 3-dimensional. E.g., track of a sea lion or path of an Argo float. • Fully 3-dimensional flow fields e.g., turbulence and convection • Utilized VisAD, a Java 3D visualization package from Bill Hibbard at the University of Wisconsin. NOAAResearch WebShop 2003, Longmont, CO
3D-Visualization - Goals • 3D visualizations to include: • 3D float trajectories, colored by the value of a variable along the trajectory. • 3D surfaces, colored by the value of a variable on the surface. • 3D vector plots. • Combining individual 3D visualizations into more sophisticated visualizations. • For example, combining bathymetry, temperature iso-surface and sea lion track. NOAAResearch WebShop 2003, Longmont, CO
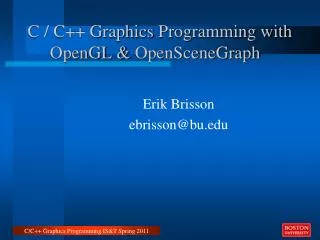
3D-Visualization - Design • User interface • Primary design goal is to keep the ncBrowse interface simple and intuitive. • Technology • Java classes were created to “wrap” the VisAD display classes. These new classes were designed in interact well with ncBrowse and the Scientific Graphics Toolkit (SGT). • Wrapping enables SGT applications to have easier access to VisAD 3D visualizations. NOAAResearch WebShop 2003, Longmont, CO
X=temperature Y=pressure Z=salinity Colored by O2
Future Directions • OPeNDAP • Continue development of OPeNDAP data access for ncBrowse. • Recognize metadata conventions typically used in the WOCE and JGOFS data files. • 3D visualizations • Placing several 3D objects in a single display. For example, bathymetry, temperature surface, and float trajectory. • Support VRML output. http://www.epic.noaa.gov/java/ncBrowse NOAAResearch WebShop 2003, Longmont, CO