Download
1 / 44
440 likes | 533 Views
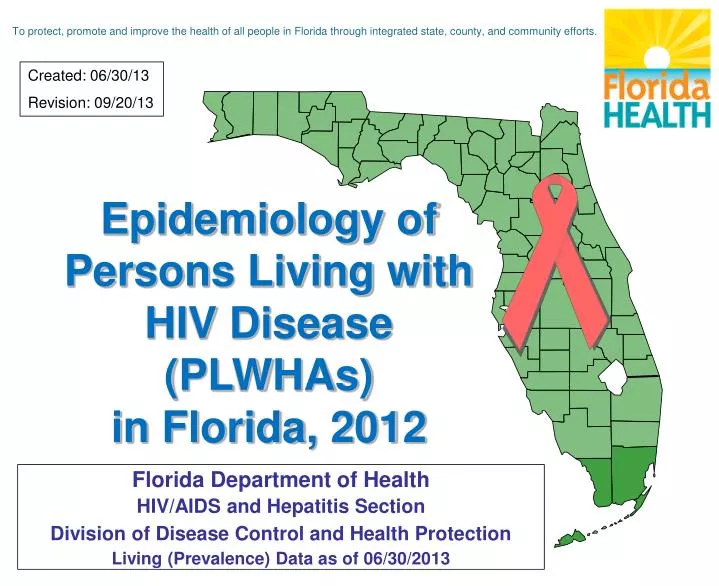
To protect, promote and improve the health of all people in Florida through integrated state, county, and community efforts. Created: 06/30/13 Revision: 09/20/13. Epidemiology of Persons Living with HIV Disease (PLWHAs) in Florida, 2012. Florida Department of Health

E N D
To protect, promote and improve the health of all people in Florida through integrated state, county, and community efforts. Created: 06/30/13 Revision: 09/20/13 Epidemiology of Persons Living with HIV Disease (PLWHAs)in Florida, 2012 Florida Department of Health HIV/AIDS and Hepatitis Section Division of Disease Control and Health Protection Living (Prevalence) Data as of 06/30/2013
Cases Living with HIV Disease • Data in these slides represent cases living with HIV Disease, also referred to Persons Living with HIV/AIDS (PLWHAs), who were reported through the most recent calendar year. Living data are also referred as prevalence cases. • HIV prevalence data are generated later in the year, usually in May, when most of the “expected” death data are complete. • Adult cases represent ages 13 and older, pediatric cases are those under the age of 13. For data by year, the age is by age of diagnosis. For living data, the age is by current age at the end of the most recent calendar year, regardless of age at diagnosis. • Unless otherwise noted, whites are non-Hispanic and blacks are non-Hispanic. • Total statewide data will include Department of Correction Cases (DOC) unless otherwise noted. County data will exclude DOC cases. • HIV “incidence estimates” are approximations of the numbers of people who are newly infected, which include those whose infection has not yet been diagnosed or reported.
The Epidemic in Florida, 2012 Population: 19.1 million(4th in the nation)Newly reported HIV infections: 5,388(2nd in the nation in 2011)Newly reported AIDS cases: 2,775(3rd in the nation in 2011)Cumulative pediatric AIDS cases: 1,544 (2nd in the nation in 2011)Persons living** with HIV disease: 98,530 (3rd in the nation in 2010)HIV prevalence estimate: at least 130,000(11.3% of the U.S. estimate for 2010)HIV Incidence Estimates 2010: 3,454(There was a 30% decrease from 2007-2010) HIV-related deaths: 923 (2012) (Down 8.2% from 2011. The first time to ever be under 1,000 deaths in a given year.) 57% White 15% Black 23% Hispanic 5% Other* 29% White 49% Black 20% Hispanic 2% Other* *Other = Asian/Pacific Islanders; American Indians/Alaskan Natives; multi-racial. Trend data as of 12/31/2012, ** Living data as of 06/30/2013
Persons Living with HIV Disease by Selected Demographics and Risk Factors U.S. (2010)* and Florida (2012) Note: M:F ratio: U.S., 3.0:1. FL, 2.4:1 Source: U.S. data: HIV Surveillance Report, 2011 (most recent available) Vol. 23, Table 15a (HIV data for all 50 states) http://www.cdc.gov/hiv/topics/surveillance/resources/reports/index.htm Florida data: FL Department of Health, HIV/AIDS and Hepatitis Section, alive and reported through 2012, as of 06/30/13.
Persons Living with AIDS by Selected Demographics and Risk Factors U.S. (2010)* and Florida (2012)** Note: M:F ratio: U.S., 3.2:1. FL, 2.4:1, Source: U.S. Data: CDC, HIV Surveillance Report, 2011, Vol. 23, Table 16a. *U.S. Living data through 2010 is most recent available. **Florida Data: eHARS, alive and reported through 2012, as of 06/30/13.
HIV Disease in theUnited States and Florida ~50,000 new HIV infections in the US per year. ~5,000 new HIV infections in Florida per year. ~In 2010, 31% of new HIV infections in the U.S. occurred among individuals aged 25-34 years, followed by 26% among individuals aged 13-24 years. ~ In the U.S., HIV was the 8th leading cause of death in 2011 for all races combined in the age group 25-44. ~ In Florida, among those aged 25-44, HIV was the 6th leading cause of death in 2012. ~More than 1.1 million people aged 13 and older are living with HIV in the US (0.3-0.4% of the US population in 2012) ~98,530 people are living with HIV in Florida(0.5-0.6% of the FL population in 2012) ~636,048 Cumulative AIDS deaths through 2010 in the U.S.
Newly Diagnosed HIV Infection Cases,HIV Case Deaths and Persons Living with HIV Disease (PLWH) by Year, 1980-2012, Florida* *Newly diagnosed HIV infection includes all new HIV cases regardless of disease status in Florida (HIV only or AIDS). HIV case deaths are HIV infection cases whose status is now dead, regardless of cause of death. PLWHs are HIV infection cases who were not known to be deceased. On 07/01/1997 HIV became reportable with a confirmed antibody test, and on 11/20/2006 HIV reporting laws were expanded; these changes in reporting inadvertently led to fluctuations in reporting. The advent of HAART in 1996, was followed by a decline in case deaths. Data as of 06/30/2013
Newly Diagnosed AIDS CasesAIDS Case Deaths and Persons Living with AIDS (PLWA)by Year, 1980-2012, Florida* *AIDS cases by year of diagnosis in FL, regardless of state of HIV diagnosis. AIDS case deaths by year of death, regardless of cause of death. PLWAs are AIDS cases who were not known to be deceased. **AIDS Case definition was expanded in 1993. Data as of 6/30/2013.
Living Case Counts N=98,530 1 to 500 501 to 1,000 1,001 to 1500 > 1500 Persons Living with HIV Disease, by County of Residence,* Reported through 2012, Florida *County totals exclude Department of Corrections cases (N=4,270). Numbers on counties are cases reported.
Statewide Rate: 517.4 Cases Per 100,000 Population N=98,530 0.1 to 100.0 100.1 to 200.0 200.1 to 300.0 > 300.0 Rates* of Persons Living with HIV Disease, by County of Residence,** Reported through 2012, Florida *Rates are based on 2012 population (denominator) data from FloridaCHARTS. **County rates exclude data from the Department of Correction.
Florida Areas Area 1 Escambia Okaloosa Santa Rosa Walton 3 HOLMES JACKSON WALTON OKALOOSA ESCAMBIA SANTA ROSA WS GD NASSAU HM JF MD CN LEON DUVAL LIBERTY BAY BK 1 SW CB 4 WK TAYLOR Area 2a Bay Calhoun Gulf Holmes Jackson Washington GF LF UN BF CLAY ST J FK 2 Area 2b Franklin Gadsden Jackson Jefferson Leon Liberty Madison Taylor Wakulla AL GC DIXIE PT FG 12 LEVY Area 7 Brevard Orange Osceola Seminole MARION VL 13 CT Area 3 Alachua Bradford Columbia Dixie Gilchrest Hamilton Lafayette Levy Putnam Suwannee Union LAKE ST SM HN Area 6 Hernando Hillsborough Manatee ORANGE 7 PASCO BREVARD OSCEOLA Area 4 Baker Clay Duval Nassau St Johns 5 HB POLK Area 5 Pasco Pinellas PN 14 IR 15 MA HR 6 OB ST LUCIE HG Area 11a Dade SS DESOTO MARTIN CHARLOTTE GLADES Area 8A Charlotte DeSoto Glades Sarasota Hendry Collier Lee Area 9 Palm Beach 9 HENDRY PALM BEACH LEE Area 11b Monroe Area 10 Broward 10 8 BROWARD COLLIER Area 14 Hardee Highlands Polk Area 15 Indian River Martin Okeechobee St Lucie Area 13 Citrus Lake Marion Sumter DADE MONROE 11 Area 12 Flagler Volusia
Adults Living with HIV Disease and Population* by Area, Reported through 2012, Florida *Source: Population estimates are provided by FloridaCHARTS
Rates* of Adults Living with HIV Disease by Race/Ethnicity, for the Top 5 Counties**in Each Category, Reported through 2012, Florida Note: The burden or impact of HIV/AIDS is greatest among blacks. *Rates per 100,000 population; Population data are from FloridaCHARTS **For Counties with >600 total PLWHAs.
One-In-Statement for Adults There were 98,291 reported adult (age 13+) Persons Living with HIV Disease (PLWHAs) in Florida through 2012. 1 in 165 adult Floridians are known to be currently living with HIV infection. By Race/Ethnicity (adults age 13+): • 1 in 333 whites are currently living with HIV infection • 1 in 49 blacks are currently living with HIV infection • 1 in 180 Hispanics are currently living with HIV infection Data as of 06/30/2013
Adults Living with HIV Disease, and State Population*, by Race/Ethnicity, Reported through 2012, Florida Living Adult HIV/AIDS Cases N=98,291 Population Estimates N=16,190,842 Note: In this snapshot of living adult HIV/AIDS cases through 2012, 49% are black, whereas only 14% of Florida’s adult population are black. This indicates a disparity of HIV/AIDS in the black population. *Source: Population estimates are provided by FloridaCHARTS **Other includes Asian/Pacific Islanders and Native Alaskans/American Indians.
Adults Living with HIV Disease,by Sex and Race/Ethnicity Reported through 2012, Florida Males N=69,202 Females N=29,089 Note: Among adults living with HIV disease, blacks represent the race most affected among both males (40%) and females (69%). *Other includes Asian/Pacific Islanders and Native Alaskans/American Indians.
Case Rates* of Adults Living with HIV Disease, by Sex and Race/Ethnicity, Reported through 2012, Florida RATE RATIOS: MALES Black:White, 4.8:1 Hispanic:White, 1.8:1 Other:White, 1:1 FEMALES Black:White, 17.9:1 Hispanic:White, 2.3:1 Other:White, 1.8:1 Note: In 2012, among black males, the case rate is nearly 5 times higher than the rate among white males. Among black females, the case rate is nearly 18-fold greater than the rate among white females. Among Hispanic females, the case rate is nearly 2 times higher than the rate among their white counterparts. The case rate among Hispanic males is equivalent to the rate among their white counterparts. *Source: Population estimates are provided by FloridaCHARTS **Other includes Asian/Pacific Islanders and Native Alaskans/American Indians.
Adults Living with HIV Disease, by Sex and Current Age Group, Reported through 2012, Florida Males N=69,202 Females N=29,089 Note: Males Living with HIV disease have a higher proportion of cases who are currently 40 years of age or older (76%), compared with females Living with HIV Disease (69%).
Adult Males Living with HIV Disease, by Race/Ethnicity and Current Age Group, Reported through 2012, N=69,202, Florida White N = 24,411 Black N = 27,468 Hispanic N = 16,036 Note: White males living with HIV disease have a higher proportion of cases living past the age of 40 (84%), compared to blacks (71%) and Hispanics (74%). Data for Other is not shown (N=1,287).
Adult Males Living with HIV Disease, by Current Age Group and Race/Ethnicity, Reported through 2012, N=69,202, Florida Note: Living male HIV/AIDS cases vary by race/ethnicity and age group. Blacks represent the highest proportions for each age group except 40-49, where whites have the highest proportion.
Adult Females Living with HIV Disease, by Race/Ethnicity and Current Age Group, Reported through 2012, N=29,089, Florida White N = 4,524 Black N = 20,104 Hispanic N = 3,915 Note: White and Hispanic females living with HIV Disease have a higher proportion of cases living past the age of 40 (73%), compared to blacks (71%). Data for Other is not shown (N=546).
Adult Females Living with HIV Disease, by Current Age Group and Race/Ethnicity, Reported through 2012, N=29,089, Florida Note: For living HIV/AIDS cases among females, blacks represent the highest proportion of living HIV/AIDS cases for each age group.
Annual Prevalence of Adults Living with HIV Disease, 1995-2012, Florida As a result of declining deaths, annual HIV/AIDS diagnoses have exceeded deaths since 1995, and the number of persons reported with HIV/AIDS that are presumed to be alive has been increasing. Since the year 1995, prevalent cases have increased by 468%. In 2012, the prevalence increased by 4.7% from the previous year.
Annual Prevalence of Adults Living with HIV Disease by Sex, 1995-2012, Florida Note: Although increases are seen among both men and women, women account for an increasing proportion of persons living with HIV disease. In 2012, women accounted for 30% of persons living with HIV disease, compared with 24% in 1995.
Annual Prevalence of Adult Males Living with HIV Disease, by Race/Ethnicity, 1995-2012, Florida
Annual Prevalence of Adult Males Living with HIV Disease, by Current Age, 1995-2012, Florida
Annual Prevalence of Adult Females Living with HIV Disease, by Race/Ethnicity, 1995-2012, Florida
Annual Prevalence of Adult Females Living with HIV Disease, by Current age, 1995-2012, Florida
Definitions of Mode of Exposure Categories • MSM = Men who have sex with men • IDU = Injection Drug Use • MSM/IDU = Men who have sex with men & Injection Drug Use • Heterosexual = Heterosexual contact with person with HIV/AIDS or known HIV risk • OTHER = includes hemophilia, transfusion, perinatal and other pediatric risks and other confirmed risks. • NIR = Cases reported with No Identified Risk • Redistribution of NIRs = This illustrates the effect of statistically assigning (redistributing) the NIRs to recognized exposure (risk) categories by applying the proportions of historically reclassified NIRs to the unresolved NIRs.
New York N=128,653 (Cases reported and confirmed through December 2010) Adults Living with HIV Disease by Mode of Exposure for Selected States MSM IDU MSM/IDU Heterosexual Other/NIR* New Jersey N=77,828 (Reported as of December 31, 2012) Florida N=98,530 (Reported as of December 2012) California N=212,442 (Reported HIV/AIDS cumulative through December 31, 2012 Compared with the other states: California and Florida have a higher proportion of MSM cases. New York and New Jersey have a higher proportion of IDU cases. New Jersey, New York and Florida have a higher proportion of heterosexual risk cases. *NIRs NOT redistributed
Adults Living with HIV Disease, by Sex and Mode of Exposure, Reported through 2012, Florida Females N=29,089 Males N=69,202 Note: NIRs redistributed. MSM is the primary risk among males (66%), followed by heterosexual (20%) and IDU (8%). Heterosexual is the primary risk among females (83%) followed by IDU (14%).
Adult Males Living with HIV Diseaseby Race/Ethnicity and Mode of Exposure Reported through 2012, Florida Hispanic N=16,037 White N=24,411 Black N=27,467 Note: NIRs redistributed. Among males living with HIV disease, the distribution of risk among blacks differs from that among whites and Hispanics. MSM represents the highest risk for all races. White males have the smallest proportion of heterosexual contact cases.
Annual Prevalence of Adult Males Living with HIV Disease by Mode of Exposure, Reported 1995-2012, Florida Note: NIRs redistributed. Males Living with HIV Disease represent those in need of care and secondary prevention initiatives to prevent further transmission. The increase in the number of living male HIV/AIDS cases is primarily attributed to fact that survival time is increasing and outnumbers the annual number of newly reported cases. MSM is the predominant mode of exposure and is increasing the fastest.
Adult Females Living with HIV Diseaseby Race/Ethnicity and Mode of Exposure Reported through 2012, Florida Hispanic N=3,915 White N=4,524 Black N=20,104 Note: NIRs redistributed. Among females living with HIV disease, the distribution of risk among whites differs from that among blacks and Hispanics. Heterosexual contact is the majority risk for all races, however, whites have the highest proportion of IDU cases.
Annual Prevalence of Adult Females Living with HIV Disease by Mode of Exposure, Reported 1995-2012, Florida Note: NIRs redistributed. Females Living with HIV Disease represent those in need of care and secondary prevention initiatives to prevent further transmission. The increase in the number of living female HIV/AIDS cases is primarily attributed to fact that survival time is increasing and outnumbers the annual number of newly reported cases. Heterosexual risk is the predominant mode of exposure and is increasing the fastest.
0 1-100 101-500 501-1,000 > 1,000 Persons Living with HIV Disease, with a Men Who Have Sex With Men (MSM) Risk,** by County of Residence,*** Reported through 2012, Florida MSM-related Risk N=49,026 *Adult Cases Only **MSM includes IDU and MSM/IDU cases ***County data excludes DOC cases (N=2,041)
0 1-100 101-500 501-1,000 > 1,000 Persons Living with HIV Disease,* with an Injection Drug Use-Associated Risk,** by County of Residence,*** Reported through 2012, Florida IDU-related Risk N=13,065 *Adult Cases Only **IDU includes IDU and MSM/IDU cases ***County data excludes DOC cases (N=1,596)
0 1-100 101-500 501-1,000 > 1,000 Persons Living with HIV Disease,* with a Heterosexual Risk, by County of Residence,** Reported through 2012, Florida Heterosexual-related Risk N=38,357 *Adult Cases Only **County data excludes DOC cases (N=1,178)
Black Heterosexual men and women White Men who have sex with Men Black Men who have sex with Men Hispanic Men who have sex with Men Hispanic Heterosexual men and women White Heterosexual men and women Black Injection Drug User White Injection Drug User Hispanic Injection Drug User Florida’s Top-9 Priority Populations in 2012 for Primary and Secondary HIV Prevention Based on Persons Living with HIV Disease
AIDS-Defining Conditions* Most Commonly Reported among Adults Alive and Reported through 2012, Florida *Note: data are NOT mutually exclusive, many cases have more than one disease. **Immune suppressed: CD4 count <200ul or CD4 percent <14%.
AIDS Cases Known to Have Been Reported with One or More of these Selected Cancers*Alive and Reported through 2012, Florida *Note: Data are NOT mutually exclusive, many cases have more than one disease.
“The reason for collecting, analyzing and disseminating information on a disease is to control that disease. Collection and analysis should not be allowed to consume resources if action does not follow.” --Foege WH et al. Int. J of Epidemiology 1976; 5:29-37
For Florida HIV/AIDS Surveillance Data Contact: (850) 245-4444 Lorene Maddox, MPH Ext. 2613 Tracina Bush, BSW Ext. 2612 Madgene Moise, MPH Ext. 2373 Visit Florida’s internet site for: Monthly Surveillance Reports Slide Sets and Fact Sheets Annual Reports and Epi Profiles http://www.doh.state.fl.us/disease_ctrl/aids/trends/trends.html Visit CDC’s HIV/AIDS internet site for: Surveillance Reports, fact sheets and slide sets http://www.cdc.gov/hiv/topics/surveillance/resources/reports/index.htm