Download
1 / 21
210 likes | 364 Views
Developing Data Quality Objectives for the National Atmospheric Deposition Program. Christopher Lehmann (NADP) clehmann@uiuc.edu. Greg Wetherbee (USGS) wetherbe@usgs.gov. Objective of Study.

E N D
Developing Data Quality Objectives for the National Atmospheric Deposition Program Christopher Lehmann (NADP) clehmann@uiuc.edu Greg Wetherbee (USGS) wetherbe@usgs.gov
Objective of Study Develop Data Quality Objectives (DQOs) for the National Atmospheric Deposition Program (NADP) to ensure that data continue to meet the needs of the research community
Outline • Introduction to the NADP • Overview of the Data Quality Objectives Process • NADP's Approach to Developing DQOs
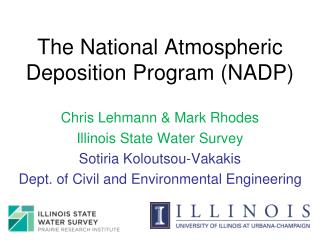
The National Atmospheric Deposition Program (NADP) • National Trends Network (NTN) • Founded 1978, currently 257 sites • Weekly precipitation sampling • Analytes: • pH, relative conductance • sulfate, nitrate, chloride, orthophosphate • ammonium • calcium, magnesium, potassium, sodium Data available at: http://nadp.sws.uiuc.edu
NADP’s Other Networks • Atmospheric Integrated Research Monitoring Network (AIRMoN) • Founded 1992, currently 8 sites • Event sampling, refrigerated samples • Same analytes as NTN, plus o-phosphate • Mercury Deposition Network (MDN) • Founded 1996, currently 90 sites • Weekly sampling • Analytes: Total mercury, subnetwork of methyl mercury Data available at: http://nadp.sws.uiuc.edu
Atmospheric Integrated Research Monitoring Network (AIRMoN) Mercury Deposition Network (MDN)
NTN NV05 Great Basin National Park MDN IL11 Bondville, IL
Quality Assurance: Answers We're Seeking • What is the total error associated with NADP chemical measurements? • What portion of total error can be attributed to each step in the data-collection process? • Are known and measurable sources of error controlled to acceptable levels? • What unmeasured sources of error can be identified, measured, and controlled?
U.S. EPA's Quality System The U.S. EPA's Quality System requires all environmental programs: "…be supported by individual quality systems that comply fully with the American National Standard ANSI/ASQC E4-1994, Specifications and Guidelines for Quality Systems for Environmental Data Collection and Environmental Technology Programs..." U.S. EPA, Policy and Program Requirements for the Mandatory Agency-Wide Quality System, Order 5360.1 A2, 2001.
ANSI/ASQC E4-1994 Planning process specified, including • identification of QA and QC requirements to establish the quality of the data collected or produced, including: • data quality indicator (DQI, as defined below) goals, • acceptable level of confidence (or statistical uncertainty), and • level of data validation and verification needed. ANSI/ ASQC, Specifications and Guidelines for Quality Systems for Environmental Data Collection and Environmental Technology Programs, 1995.
The Data Quality Objectives (DQO) Process • 7 Steps for DQO Planning Team • State the Problem • Identify the Decision • Identify the Inputs to the Decision • Define the Boundaries of the Study • Develop a Decision Rule • Specify Tolerable Limits on Decision Errors • (e.g. a= 0.05, b=0.20) • Optimize the Design for Obtaining Data • (e.g. cost effectiveness)
Good? Bad? USGS QUALITY ASSESSMENTS • Document past performance of laboratories, site operators, and field equipment in terms of absolute and relative error. 2. Document “trends” in performance from one year to next. Improving? No change? 3. Never state whether performance meets expectations.
Step 2: Identify the Decision(s) • Potential Decisions: • Constituent concentrations in precipitation are decreasing [or increasing]. • NTN data quality is “acceptable.” • Others?
Step 5: Develop Decision Rule(s) …if, then statements • Potential Decision Rules: • If a Seasonal Kendall Test detects a negative [or positive] slope, thenconstituent concentrations in precipitation are decreasing [or increasing]. • Ifmedian collocated-sampler [or substitute other program] absolute error is less than or equal to X% percent, then data quality is “acceptable.”
Step 6: Specify Tolerable Limits on Decision Errors • Step 6 determines: • How many samples need to be collected (N) • …generally, N becomes larger as a and b get smaller • Spatial distribution of samples (e.g. grid spacing) • …generally, grid spacing tighter as a and b get smaller • Temporal distribution of samples (e.g. seasonality)
NADP/NTN QA DQOs Does the NADP/NTN Fit Into the DQO Process? No: DQOs: DQOs define number (N), quality, and spatial/temporal distribution of samples required to make decisions with a pre-specified level of statistical confidence. NADP/NTN: Natural environment and funding control the number and spatial distribution of NTN samples. Therefore, a and b would have to vary geographically. This complexity would limit spatial interpretation of the data.
NADP/NTN QA DQOs Does the NADP/NTN Fit Into the DQO Process? No: DQOs: DQOs are for making decisions about two clear alternatives (e.g. whether action levels are exceeded or not; clean precipitation vs dirty; etc.). NADP/NTN: Data analysis not always conducive to making yes/no decisions. Lots of “gray areas.” Probability of Type II error (b) would likely be high.
Data Quality Indicators • completeness – amount of valid data obtained compared to the amount that was possible when Standard Operating Procedures (SOPs) are followed. • uncertainty – the combination of the variability and bias in the data. Variability is defined as a measure of mutual disagreement among individual measurements of the same property. Bias is defined as the systematic or persistent distortion of a measurement process that causes errors in one direction. • resolution – a measure of the selectivity and sensitivity of data-collection methods such that data users can distinguish between signals and noise. • comparability – a measure of the confidence with which one data set can be compared to another. • representativeness – a measure of the degree to which the sample data accurately represent the characteristics of a population.
Acknowledgements The NADP receives support from the U.S. Geological Survey; Environmental Protection Agency; National Park Service; National Oceanic and Atmospheric Administration; U.S. Department of Agriculture-Forest Service; U.S. Fish & Wildlife Service; Bureau of Land Management; Tennessee Valley Authority; and U.S. Department of Agriculture - Cooperative State Research, Education, and Extension Service via cooperative agreement. Additional support is provided by other federal, state, local, and tribal agencies, State Agricultural Experiment Stations, universities, and nongovernmental organizations.