Download
1 / 10
100 likes | 105 Views
This analysis aims to determine the optimal run length for Run-9 in di-electron measurements by calculating the statistical and systematic errors. Measurements of electron yield and HBD statistics will be used to estimate the improvement factor over Run-4. The effect of HBD rejection and its impact on the combined error will also be evaluated.

E N D
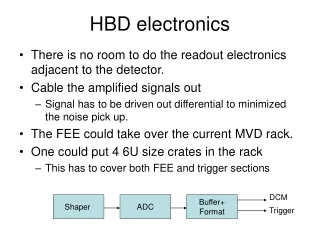
HBD Impact Statistics TK Hemmick T. Dahms
Considerations in Run-9 Length • Adding the HBD will improve the performance of PHENIX in di-electrons by some factor. • This improvement will include a statistical term as well as a systematic term. • We’ll calculate both of these kinds of errors and their quadrature sum to judge what run lengths would be best for Run-9. • This will involve some estimate of the relative size of the statistical and systematic error bars at present. • NOTE: We will steal these from some plots, for expediency so that the estimates are somewhat rough.
Measurements of the electron yield • This plot has raw counts after background. • We will take a desired bin to have 500 counts and a Signal/Background = 0.01. • This assumes that the physics result uses 5 MeV bins (scale in your head…)
HBD Statistics • HBD will reduce the background by “R” • Design Report (no charm): R=100 • Drees to H/L (w/ Charm): R=30 • Akiba (during meeting): R=10 • Worst case: R=5 • Some signal will accidentally be lost at the same time (Signal = E*Signal): • Design report: E=0.6 • In Run-9, we can assume that we measure a factor of F more data than Run-4 (F can be less than 1). • Measure of significance of measurement is: • The continuum in Run-4 has roughly Signal = 0.01*Background • We can measure the factor of improvement over the Run-4 result as a function of F for various scenarios of HBD rejection.
HBD Systematics • The present systemetic error in the background is a normalization error of 0.25% • We will assume that this error of 0.25% remains as a constant percentage error. • In this case, the Signal/Error is: • Quality of measurement improves linearly with R
Adding the Error in Quadrature • Lacking a better way to combine errors, we’ll add the statistical and systemetic absolute errors in quadrature (assuming signal = 500 counts and S/B=0.01) • We can then calculate the improvement in Signal/total-error as a function of the run parameters…
Relative error results • With no rejection from the HBD, systematic errors take over the data (remember fine binning…5 MeV/c^2 bins!) • Even with a modest rejection of only 5X, the statistical error takes over the full error for all reasonable run lengths. • Combined error on the next slide…
Combined error of the run… • The loss of efficiency would mean that without rejection, we would need to run longer than Run-4. • Desired run length depends entirely on the acceptable level of fractional error. • NOTE: You can scale with bin width in these plots by SQRT(REBIN) from the starting point of 5 MeV bins. • Zoom in on the shorter run region…
Zoom in on total relative error • Same conclusions hold…
Improvement Factor over Run-4 • This puts the question into an improvement factor as a function of run length…