Download
1 / 17
170 likes | 193 Views
This study proposes an efficient method for generating a network topology with multilevel hierarchy, controllable reliability, and lower average degree. The approach involves constructing subnetworks at different levels of the hierarchy and attaching LANs to the network. The model aims to address routing, resource reservation, and administration problems in the Internet.

E N D
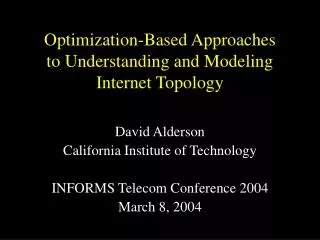
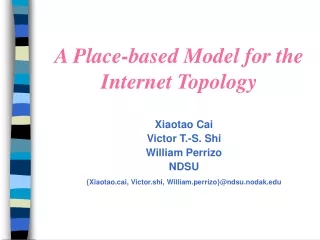
A Place-based Model for the Internet Topology Xiaotao Cai Victor T.-S. Shi William Perrizo NDSU {Xiaotao.cai, Victor.shi, William.perrizo}@ndsu.nodak.edu
Introduction • Internet has grown from the early research prototype to a global communications system that reaches most countries in the world. • It has problems in routing, resource reservation, and administration. Simulating the Internet plays a vital role in attempting to address such problems. • Conclusions reached about the suitability and performance of algorithms may vary depending on the methods used to model the network topology. • An Autonomous System (AS) is a network under a single administrative authority (WAN). • The Internet can be considered as interconnected ASs with a multilevel hierarchy • Large ASs (e.g.,, Large Internet Service providers such as AT&T, UUNET,…) are reliable (When a few of nodes fail it still works - still connected, highly reliable). • We introduce -reliability as a new metric to characterize and evaluate reliability. • We propose an efficient method for generating a network topology not only with basic properties: multilevel hierarchy, AS, lower average degree, and controllable (hop-diameter), but also with controllable -reliability.
UUNET (AS) Backbone (3/6/2001) - Some nodes (NYC, SF…) form core, while others have been added step-by-step - We eliminate the leaves to get at the backbone. - Backbone has * Connectivity at least 2 * Longer links * Forms a mesh * highly reliable - Thus, we use connectivity of nonleaf backbone as a reliability metric: FIGURE 1
Approach • If U is a subset of nodes of a network N, then the subnetwork <U> induced by U is that network having node set U and link set consisting of all those links of N whose endpoints are in U. • The -backboneof N is < { v V | link, uv : c(u, v) d} >, where V is the set of nodes of N, c the link capacity (modeled as distance, d the diameter of N, 0 < < 1. • We remove one leaf node of the -backbone at at time until there are no leaves left. • The resulting subnetwork (possibly empty) is a nonleaf -backbone of the network N. • Finally, we define the connectivity of the nonleaf -backbone of N to be the-reliabilityof N. • The -reliability of the empty graph is –1. • The is chosen to be 0.12 in this study.
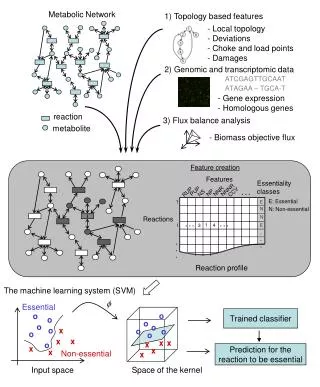
Our Method • To generate networks that reflect the properties of the multilevel hierarchy, 3 or 4 hierarchy levels are structured, corresponding to global area networks, national area networks, MANs, or LANs respectively. • To construct sub-networks of global area, national area, or MANs with the required -reliability, the generation process begins at the top level in the hierarchy, and proceeds down to lowest level of the hierarchy. • First, the top level is generated in a W H rectangle. • Next, we randomly generate a subnetwork at the next lower level within a smaller rectangle in a similar fashion. • Then, we replace each node of the preceding network of the higher level with a subnetwork. • Finally, the LANs are attached. We propose two generators, NBND–G for the global networks and NBND–N for the national networks.
Network at world level Network at nation level Network at nation level Net. at region level (MAN) Net. at region level (MAN) Net. at local level (LAN) Net. at local level (LAN) Sender in NYC Receiver in Beijing
NBND-G • Step 1----place C nodes randomly on a W H rectangular area such that the Euclidean distance between any two nodes is not less than (W W + H H)1/2 / 7. Then, the nodes are connected to each other to form a complete graph, which is the core of the backbone of the network generated. • Step 2----let S be the integer part of 5 (T – C – F) / 9. Place S nodes randomly and recursively on the W H rectangular area such that the Euclidean distance from any current node is not less than (W W + H H)1/2 / 10 and the added node is connected to the K distinct core nodes closer to it, but to the (K+1)th core node according to the probability 0.2. • Step 3----place T – C – S – F nodes randomly and iteratively on the W H rectangular area such that the Euclidean distance from any current node is not less than (W W + H H)1/2 / 13 and the added node is connected to the K current distinct nodes closer to it, but to the (K+1)th node according to the probability 0.2. • Step 4----place F nodes randomly and iteratively on the W H rectangular area such that the Euclidean distance from any current node is not less than (W W + H H)1/2 / 17. Then, the added node is connected to a current node closer to it. • Step 5----let h be the integer part of N / 6. Repeat the preceding four steps within a W / 9 H / 9 rectangular area and with T = N, C = h + 1, and F = h to form a subnetwork of the national level. Then place a node of the subnetwork of the top level by the subnetwork such that the placed node overlaps a core node of the national level and each of some core nodes of the national level are connected to at least K nodes connected by the replaces node. Finally, repeat this process until all nodes of the top level have been done. • Step 6----repeat the Step 5 with M and a W / 18 H / 18 rectangular area instead of N and the W / 9 H / 9 rectangular area respectively. • Step 7----place each node of the subnetwork given through Step 6 by a LAN of L nodes which is modeled in a W / 35 H / 35 rectangular area asa tree topology such that the placed node overlaps one of the nodes of bigger degrees in the LAN.
A network of 1463 nodes generated by NBND-G with 0.12-reliability 2: FIGURE 2
NBND-N For NBND-N repeat steps 1 through 7, combining setps 5 and 6: (step 6 with M and a W / 18 H / 18 rectangular area instead of N in Step 5 and the W / 35 H / 35 rectangular area in Step 7 respectively). (302 nodes generated with 0.12-reliability 4 and red backbone) FIGURE 3
NBND-N 605 nodes with 0.12-reliability 2 and its backbone colored red:FIGURE 4
Visualization of the Models • Our method is based on the placement of nodes on a plane and controls the size of each level of the hierarchical network. • Through our free software, the generated network can be visualized. • Source code and visualization code for NBND is available at http://www.cs.ndsu.nodak.edu /~cai
Examples from other models • 30 network nodes generated by Tiers model [K. Caivert, M.B. Doar, and E.W. Zegura, Modeling Internet topology, IEEE Communication Magazine, June 1997, 160-163.
Examples from other models • 360 network nodes generated by Tiers model [K. Caivert, M.B. Doar, and E.W. Zegura, Modeling Internet topology, IEEE Communication Magazine, June 1997, 160-163.
Examples from other models • 100 network nodes generated by GT-ITM model [http://www.cc.gatech.edu/fac/Ellen.Zegura/graphs.html, 1997.
Examples from other models • 600 network nodes generated by GT-ITM model [http://www.cc.gatech.edu/fac/Ellen.Zegura/graphs.html, 1997.
Conclusion • In this paper we presented methods for generating network topologies with important properties, which reflects the basic topological structure of a large real network, or a collection of real networks such as the Internet. • The generated networks have the reliabilityas we expect. • Another contribution is the introduction of -reliability as a new metric to characterize and evaluate the reliability of a real network. • As the Internet is changing rapidly, one goal of our future work is to look for the metrics that can be used to quantitatively evaluate topology generators. • E.g., power laws reported in [11] were used for this purpose • but they were severely questioned by [15], which presented a thorough analysis on more complete data collected from various sources.
References • Sally Floyd and Vern Paxson, Difficulties in simulating the Internet, to appear in IEEE/ACM Transactions on Networking, 2001, http://www.aciri.org/floyd/papers.html. • [2] Ellen W. Zegura, et al, A quantitative comparison of graph-based models for Internet topology, IEEE/ACM TRANSACTIONS ON NETWORKING, Vo l5, No 6, 1997, 770-782. • [3] Cheng jin et al, Inet,CSE-TR-433-00, http://topology.eecs.umich.edu/inet/, 2001. • [4] S. Keshav, Engineering Approach to computer Networks, Addison-Wesley, 1997. • [5] CIADA, http://www.caida.org/tools/visualization/mapnet/Backbones/ 2001. • [6] B. M. Waxman, Routing of multipoint connections, IEEE JSAC, v6:9, 1617-22. • [7] M. Doar, I. Leslie, How bad is naïve multicast muting, INFOCOM’ 93, 82-89. • [8] L. Wei and D. Estrin, The trade-offs of mutlicast trees and algorithms,” in Int. Conj Computer Communications and Networks Aug. 1994. • [9] M. B. Doar, A better model for generating test networks, Globecom ’96; Nov. 1996. • [10] K. Caivert, M.B. Doar, and E.W. Zegura, Modeling Internet topology, IEEE Communication Magazine, June 1997, 160-163. • [11] M. Faloutsos, P. Faloutsos, and C. Faloutsos, On power-law relationships of the Internet topology, Proc. SIGCOMM ’99, 251- 262, Aug. 1999. • [12] G. Chartrand and L. Lesniak, Graphs & Digraphs, Wadsworth & Brooks. 1979. • [13] R. Siamwalla, R. Sharma, and S. Keshav, Discovering Internet Topology, http://www.cs.cornell.edu/skeshav/papers/discovery.pdf, 1999. • [14] http://www.cc.gatech.edu/fac/Ellen.Zegura/graphs.html, 1997. • [15] Q. Chen et al, Origin of power laws in Internet topologies revisited, INFOCOM 2002. Source Code • Source code for generator: NBND is available at http://www.cs.ndsu.nodak.edu /~cai