Download
1 / 31
310 likes | 384 Views
WORKSHOP. 15 to Finish Enrollment Intensity and Student Achievement Campaign. Advisor/Recruiter Workshop CSN, NSC, UNLV March 28, 2013. Creating a Culture of Completion. Today’s Presentation What: 15 to Finish Campaign Why: Data, data, data

E N D
WORKSHOP 15 to Finish Enrollment Intensity and Student Achievement Campaign Advisor/Recruiter Workshop CSN, NSC, UNLV March 28, 2013
Creating a Culture of Completion Today’s Presentation What: 15 to Finish Campaign Why: Data, data, data How: Campaign Toolkit; Advising Strategies Campaign Endorsed in 2013 by Board of Regents and your Presidents
U.S. Ranking Among Nations for 25-34 Year Olds with an Associate’s Degree or Higher 1996 2010 Among developed nations, the U.S. ranks 14th for its educated youth. Source: Bridging the Higher Education Divide, The Century Foundation Press, May 22, 2013
How it all began . . . The Goal of the Obama Administration To be first among nations by 2020, 60% of 25-34 year olds in the United States will need to have a postsecondary credential. Source: Bridging the Higher Education Divide, The Century Foundation Press, May 22, 2013
Percent of Adults 25 to 34 with an Associates Degree or Higher NV 28.3% 50th National Average: 40.1%
Complete College America For a strong economy, the skills gap must be closed. 58% By 2020, jobs in Nevada requiring a career certificate or college degree 28% Nevada adults who currently have an associate degree or higher 30% The Skills Gap Source: Time is the Enemy, Complete College America, 2011
Creating a Culture of Completion What we have already done • Complete College America • Strategic Directions • 120 / 60 credit policy • Low Yield Program Policy • Excess Credit Policy • Access and Affordability • New Funding Formula • Performance Pool • 15 to Finish Campaign A shift in focus from enrolling to graduating students . . . but there is more work to be done.
Shifting Gears Promoting Student Completion through Policy • 60/120 Credit Policy • Limiting the number of credits for an associates or bachelor’s degree to 60 and 120 credits, respectively • Low Yield Policy • Requiring institutions to review programs on a regular basis in the context of degree productivity. Institutions must develop a plan for increasing productivity or eliminate the low-yield program • Excess Credit Policy • Tough love policy – charging students a 50 percent surcharge if they accumulate more than 150 percent of the credits required for their degree program
Is any of this making a difference? Percent Change in Awards Conferred, 2010 thru 2012 Bottom Line: YES!!! A 21% increase in awards conferred in the first three years of Complete College America participation -- the policy initiatives and campaigns associated with CCA are making a difference relative to other state and the national average (13.5%)! Making a Difference Source: NCHEMS, NCES, IPEDS 2009-10, 2011-12 Completions FileAwards include 30+ credit certificates, associates degree, and bachelor’s degrees
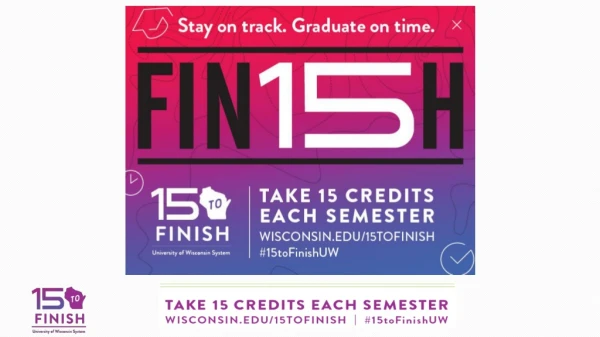
What: 15 to Finish Campaign • Encourage full-time enrollment – 15 credits per semester or 30 credits per year • Complete a 4-year degree in 4 years • Complete a 2-year degree in 2 years • Finish college faster and start a career that provides financial independence • Meet Complete College America goals • Use a mix of media to target 18-24 year olds and their parents • Facebook • Public Service Announcements • Student Newspapers • Videos at college tours/fairs, high school senior parent nights & senior events, in public places like dining commons, student unions, etc… • Student advising / Student orientation
FOCUS OF CAMPAIGN 15 to Finish Encouraging students to enroll in 15 credits per term OR 30 credits per year • Targeted Student Population: • Ages 18 to 24 • Taking 12 to 14 credits
Shift Focus to Benefits of 15 Hours/Semester = Full Time • Benefits include: • Progress from freshman to sophomore status after first year; • More likely to graduate; • Pay less in tuition and living expenses; • Gain additional years of earnings; • Free up limited classroom space for other students Source: The Power of 15 Hours, Enrollment Intensity and Postsecondary Student Achievement by Dr. Nate Johnson. Fall 2012
What is Full-Time? • For some purposes, “full-time” is less than 15 credits per semester: • Millennium Scholarship: 12 credits/semester • IPEDS: 12 or more credits/semester • BUT, taking only 12 credits per semester, students will: • Take more than 4 years to complete a bachelor’s and more than 2 years to complete an associates degree • Not achieve sophomore status after first year (Sophomore = 30 credits at all institutions)
National Perspective • Complete College America • The Power of 15 Credits: Enrollment Intensity and Postsecondary Student Achievement; April 2013 • Findings: • Students who enrolled full-time in their first year were more than twice as likely to earn a degree as those who took fewer. • Regardless of academic preparedness or preparation, work schedules, race, gender, or socioeconomic categories, data shows that almost all students are more likely to complete with a real full-time load.
To the extent students can go full-time at any point, increased likelihood of completing. National Perspective National Student Clearinghouse Research Center Four-Year Public Institutions Part-time students far less likely to graduate *Completed: Includes students who completed at starting or different institution **Mixed Enrollment: Both part-time and full-time during the study period Source: Completing College: A National View of Student Attainment Rates, National Student Clearing House, December 2013
To the extent students can go full-time at any point, increased likelihood of completing. National Perspective National Student Clearinghouse Research Center Two-Year Public Institutions Part-time students far less likely to graduate *Completed: Includes students who completed at starting or different institution **Mixed Enrollment: Both part-time and full-time during the study period Source: Completing College: A National View of Student Attainment Rates, National Student Clearing House, December 2013
National Perspective (continued) • National Center for Education Statistics • Undergraduates enrolled full-time – 30 or more credits completed in first year – are more likely to graduate on time than students who completed fewer credits per year. • Source: National Beginning Postsecondary Student Survey, 2004-09 • Withdrawal rates are lower for full-time students. One-third of part-time students withdrew in their first year. • Source: NCES Report 2011-12
Data: 2-year & CSN Graduation Rates by Credit Load CSN – Fall 2008 Cohort Undergraduate students who are enrolled full-time are more likely to graduate from college. 88.6% 77.4% NSHE 2-Year Institutions – Fall 2008 Cohort % Graduated NOTE: Fall 2008 cohort, first-time, degree seeking students, who earned a certificate or associates degree at a community college within 200% time to degree; Enrollment load based on first term. % Not Graduated
Data: 4-year & NSC Graduation Rates by Credit Load NSC – Fall 2004 Cohort Undergraduate students who are enrolled full-time are more likely to graduate from college. 88.6% 77.4% NSHE 4-Year Institutions – Fall 2004 Cohort % Graduated NOTE: Fall 2004 cohort, first-time, degree-seeking students, who earned a bachelor’s degree within 200% time to degree at a 4-year institution. Enrollment load based on first term. % Not Graduated
Data: 4-year & UNLV Graduation Rates by Credit Load UNLV – Fall 2008 Cohort Undergraduate students who are enrolled full-time are more likely to graduate from college. 88.6% 77.4% NSHE 4-Year Institutions – Fall 2008 Cohort % Graduated NOTE: Fall 2004 cohort, first-time, degree-seeking students, who earned a bachelor’s degree within 200% time to degree at a 4-year institution. Enrollment load based on first term. % Not Graduated
Data: 2-yr & CSN Graduation Rates by Credit Load and Ethnicity CSN – Fall 2008 Cohort NSHE 2-Year Institutions – Fall 2008 Cohort Regardless of race or ethnicity, undergraduate students who are enrolled full-time are more likely to graduate from college. NOTE: Fall 2008 cohort who earned a certificate or associates degree at a community college within 200% time to degree. Enrollment load based on first term.
Data: 4-yr & UNLV Graduation Rates by Credit Load and Ethnicity NSC – Fall 2004 Cohort Cohort population too small to report Regardless of race or ethnicity, undergraduate students who are enrolled full-time are more likely to graduate from college. UNLV – Fall 2004 Cohort 4-Year Institutions – Fall 2004 Cohort NOTE: Fall 2004 cohort who earned a bachelor’s degree within 200% time to degree at a 4-year institution. Enrollment load based on first term.
Persistence Rates NOTE: Analysis includes cohorts from Fall 2009, 2011, and 2012, first-time, degree-seeking freshmen Full-time students are significantly more likely to persist to the next semester.
Persistence Rates NOTE: Analysis includes cohorts from Fall 2009, 2011, and 2012, first-time, degree-seeking freshmen Full-time students are significantly more likely to persist to the next semester.
Data: Cohort GPA by Academic Preparation Lacking other data elements, placement into remedial English and/or mathematics was used as a proxy for academic preparation. Regardless of academic preparation, students enrolled full-time have higher grade point averages. NOTE: Fall 2008 cohort of first-time, degree-seeking freshmen.
Data: Cohort GPA by Academic Preparation Lacking other data elements, placement into remedial English and/or mathematics was used as a proxy for academic preparation. Regardless of academic preparation, students enrolled full-time have higher grade point averages. NOTE: Fall 2008 cohort of first-time, degree-seeking freshmen.
Data: Target Population The 15 to Finish campaign will target students ages 18 to 24. Distribution of Freshmen by Credit Load (Fall 2012) NOTE: First-time, degree-seeking freshmen, ages 18 to 24
Campaign Toolkit Web Site: http://www.nevada.edu/15 • Logos • Postcards • Poster • Student Handout • Video • Workshop presentations
Advising Strategies • Benefits to Students • Long-term reduction in tuition and related costs if earn degree sooner • Less debt after graduation • Better chance of completing • Emphasize Different Approaches to Achieve Goal of 30 Credits Per Year • “15 to Finish” (15 credits/semester) • 12-12-6 (12 credits/semester plus summer courses) • Winter and summer terms • Other Institutional Support Approaches • Block Scheduling • Guided Pathways • Campaign Tool Kit