Download
1 / 17
170 likes | 174 Views
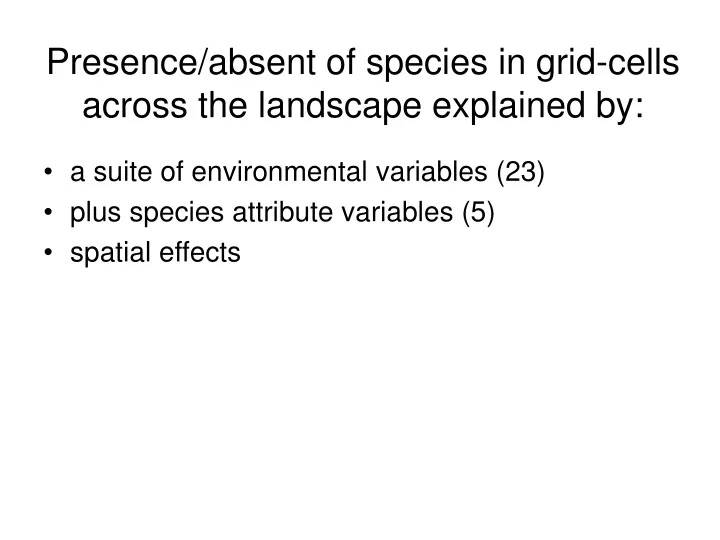
Presence/absent of species in grid-cells across the landscape explained by:. a suite of environmental variables (23) plus species attribute variables (5) spatial effects. Kogelberg-Hawequas sub-region Sample locations, with a 1x1 minute grid overlain (~41 x 107 km = 1554 grid cells)

E N D
Presence/absent of species in grid-cells across the landscape explained by: • a suite of environmental variables (23) • plus species attribute variables (5) • spatial effects
Kogelberg-Hawequas sub-region Sample locations, with a 1x1 minute grid overlain (~41 x 107 km = 1554 grid cells) [versus ~37,000 cells for full CFR]
Full Model: Protea cynaroides 10 significant environmental covariates (Betas)
Full Model: Sorocephalus imbricatus 0 significant environmental covariates (Betas)
$ T $ T $ T $ T T $ T $ $ T $ T T $ T $ T $ $ T T $ $ T $ T T $ $ T T $ T $ T $ $ T $ T T $ T $ $ T $ T T $ T $ M . a r b o r e u s $ T $ T # S T $ T $ T $ $ T $ T $ T M . a r g e n t e u s T $ T $ T $ $ T $ T $ T $ T $ T $ T T $ $ T T $ T $ $ T $ T T $ T $ $ T T $ $ T $ T T $ T $ $ T T $ T $ T $ T $ $ T T $ T $ $ T $ T $ T T $ P r o b a b i l i t y $ T T $ $ T T $ $ T $ T $ T $ T $ T $ T T $ T $ $ T $ T 0 - 0 . 0 1 0 . 0 1 - 0 . 0 5 0 . 0 5 - 0 . 1 # S 0 . 1 - 0 . 2 # S # # S S # # # S # # S S S S # S # S # # S # S S # S # S # # # S S # S S # S # S # # S S 0 . 2 - 0 . 3 5 # S # S # # S S # S # S 0 . 3 5 - 0 . 6 # # 0 . 6 - 1 S S # S # # # # S S S # # S # S S S # S # S # S # S Sister-Species “Ghosting” M. arboreus M. argenteus
Hakea sericea (silky needlebush), introduced from Australia: projected distribution and uncertainty in distribution.
Species distribution predictions of the full Cape Floristic Region