Download

1 / 17
170 likes | 318 Views
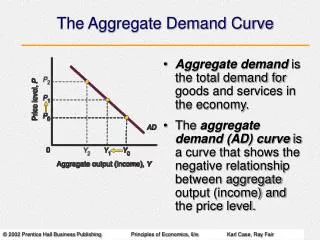
Net CONE for the ISO-NE Demand Curve. Final Proposal. NEPOOL Markets Committee. Samuel Newell, Brattle Chris Ungate , Sargent & Lundy. March 12, 2014. Agenda. Responses to Stakeholder Comments, and Associated Revisions Electrical Interconnection Network Upgrade Costs

E N D
Net CONE for the ISO-NE Demand Curve Final Proposal NEPOOL Markets Committee Samuel Newell, Brattle Chris Ungate, Sargent & Lundy March 12, 2014
Agenda • Responses to Stakeholder Comments, and Associated Revisions • Electrical Interconnection Network Upgrade Costs • Oil Inventory and Other Non-Depreciable Assets • CT E&AS RTR Payback • CC E&AS Representative Units • Electricity Forwards and PER/PFP Assumption • Consideration of Lumpiness • Summary of Changes • Recommendation • Principles for Selecting Reference Technology • Review of Reference Technologies • Recommended Net CONE Based on CC • Locational Net CONE
Electrical Interconnection Transmission Costs from 15.5 Applications • Based on stakeholder feedback, we re-visited network upgrade cost assumption • Transmission costs reported in Section 15.5 Applications show that the average historical cost of network upgrades beyond the generator lead was $35/kW (2013$) • We adopt the reasonable assumption that generic future projects expect to pay the same on a $/kW basis, plus $1.1m for ½ mile lead based on S&L estimate Source: ISO-NE assembled from publicly available Section 15.5 Applications.
Oil Inventory and Other Non-Depreciable Assets • Stakeholders requested that we review how fuel inventory and working capital are accounted for in the financial model • As the fuel inventory will hold residual value at the end of the economic life, we credited back to the capital costs the present value of the fuel inventory in 2038 based on long-term EIA escalation rates (+2.4%/year) • Relatedly, we updated our calculation of depreciable costs based on accepted GAAP principles, which specifies that land, fuel inventory and working capital be considered non-depreciable
Real-Time Reserve Charge-Backs and Other E&AS Adjustments to CTs • Real-Time Reserve Charge-Backs: To better estimate CT E&AS revenues, we incorporated data from ISO-NE on forward reserve obligation charges • Portfolios with FRM will receive real-time reserve revenues that will later be charged back • Using only asset-specific market settlement data over-estimates CT E&AS as the obligation charges occur after the settlement at the portfolio level • Adding ISO-NE’s portfolio-level charge-back data reduces the CT E&AS by $0.13/kW-mo • Heat Rates: We adjusted fuel costs for the Frame CT and LMS100 based on their heat rates relative to the LM6000 sample plants • Calculation Adjustments: We adjusted our calculation of the E&AS margin across the plants in our sample from a simple average to capacity-weighted average; also we resolved a fuel cost calculation issue during our final audits of the analysis
CC E&AS Representative Units • Based on stakeholder feedback, we refined our approach for selecting the representative CC plants used to calculate historical E&AS revenues • We received market revenue data from ISO-NE for 20 plants • We removed 6 plants with average realized heat rates above 8,000 Btu/kWh • We removed 6 plants with fuel costs that are not represented by Algonquin Citygates prices due to firm gas capacity, alternative sources of fuel, or plants with gas pricing based on Iroquois • We removed 2 plants with different operations mode such as district heating and low CF (<20%) • The remaining 6 plants have an average capacity factor of 58% and average heat rate of 7,400 Btu/kWh; the CC E&AS increases by $0.04/kW-mo due to this change
Forward Curves Mass Hub On-Peak Futures and Open Interest (ICE) • Stakeholders requested futures data be used even if volume is thin • We show Open Interest for ICE, which expresses the amount of forward contracts actually doing daily mark-to-market settlement on these prices • We also compared to other sources available (NYMEX, ICE, Platts), which are in close agreement • We will use ICE data in E&AS analysis instead of previous average of NYMEX and OTC as it more often used and is publicly available Mass Hub On-Peak Futures (All Sources) Sources: See appendix.
H Value for PER/PFP Estimates • Stakeholders were concerned that assuming H = 10.9 for estimating PER and PFP is inconsistent with the electricity futures • We have reviewed the implied market heat rate from the ICE forward curves for gas and electricity and agree that the lowest H case (H = 5.8) is a better assumption for our analysis • At H = 5.8, the PER deduction will be $0.43/kW-mo and the PFP payment will be $0.06/kW-mo; this contributes $0.37 to Net CONE, which is $0.41/kW-mo less than the initial analysis ICE Futures and Implied Market Heat Rates Sources and Notes: ICE futures were obtained from www.theice.com. Trades are averaged from Feb 20 to Feb 28, 2014
Why Lumpiness Should Not Add to Net CONE • The demand curve was designed so that Net CONE is the long-term average prices an entrant can expect, not their entry price • Our curve design and simulations are consistent with lumpiness and other sources of volatility making entry more likely when P > Net CONE, at the higher end of our price distributions • Consider a simple example where a 600 MW unit enters at point A and clears with 600 MW overhang (worst case for lumpiness); with 300 MW/yr load growth, the next auction clears about 300 MW to the right, at point B. The following auction adds 300 MW load, so we’re back at point A and the cycle repeats • The entrant earns Net CONE on average, and the curve achieves the reliability objectives of 1-in-10, with average quantity at about 1% above NICR (addressing reliability asymmetry) • If instead, we moved the curve up so the price at NICR + 1% were the entry price (pt. C) rather than Net CONE, we’d over-procure, with an average reserve margin at D
Agenda • Responses to Stakeholder Comments, and Associated Revisions • Electrical Interconnection Network Upgrade Costs • Oil Inventory and Other Non-Depreciable Assets • CT E&AS RTR Payback • CC E&AS Representative Units • Electricity Futures and PER/PFP Assumption • Consideration of Lumpiness • Summary of Changes • Recommendation • Principles for Selecting Reference Technology • Review of Reference Technologies • Recommended Net CONE Based on CC • Locational Net CONE
Principles for Selecting a Reference Technology • Objective • Estimate Net CONE that supports prices that are on a long-term average basis just high enough to attract sufficient new investment to meet resource adequacy objectives • Criteria for selecting the Reference Technology to meet the objective • Reliably able to help meet load • Complies with all environmental regulations • Dispatchable technology that could be available to generate whenever capacity is scarce • Likely to be economic for merchant entry as part of long-term equilibrium • Demonstrated commercial interest by merchant developers, as evidenced by projects recently completed, under construction, or in the queue in New England or the rest of U.S. • Estimated Net CONE is not so high as to make it implausible that the technology would be part of the long-term mix of resources entering the market • Available as standardized, utility-scale commercial plants without inherent constraints on the amount that could enter • Can estimate Net CONE with low uncertainty • Cost estimates have less uncertainty, based on established, standardized technologies • E&AS estimates have less uncertainty relative to other technologies • Additional considerations • Several technologies might be economic in a long-term equilibrium, with the same long-term average Net CONE, even if not currently economic due to temporary market conditions • It is important not to switch reference technologies back and forth over time, particularly not in pursuit of the technology whose Net CONE is temporarily lowest, as doing so will tend to under-procure • If multiple technologies meet the criteria, taking an average of their Net CONEs could help stabilize market outcomes and reduce the risk of estimation errors
Net CONE Recommendation • We recommend the 2x1 CC as the Reference Technology with Net CONE at $11.08/kW-mo • CCs are clearly part of the equilibrium mix, so how wrong could choosing it be? • Clear signals from merchant developers through past, current, and proposed projects • Near-lowest Net CONE • CC Net CONE estimation uncertainty is no higher than for CTs • Most experience with technology • CC E&AS estimation uncertainty is not demonstrably higher than CTs in New England • Since the Frame CT’s Net CONE is lower, choosing it could risk under-procurement if it cannot actually be built at the cost we estimated • The lack of commercial activity suggests the possibility of risks or costs that are not captured in our analysis (alternatively, perhaps the SCR capability is too new to be showing up in projects yet but will soon; also possible that CTs just aren’t as economic as CCs in places where merchants are building) • Our simulation analysis showed that the reliability risks of understating True Net CONE are much more serious than over-procurement risks of overstating True Net CONE • In an FCM market with little history of merchant entry, launching a new demand curve that might not support sufficient entry could set up the new market for failure • The Aero CTs’ Net CONE is too high to be plausibly part of the economic equilibrium mix of technologies • Averaging multiple reference technologies could help stabilize market outcomes and reduce the risk of estimation errors; however, we recommend only the CC here • The reasons we identified for not 100% relying on turbines in ISO-NE suggest not relying on them 50% either
Locational Net CONE • CC CONE for NEMA/Boston is only slightly higher than rest-of-pool (ROP) • Assumed the plant would be located in Lowell, MA • Modified the ROP analysis based on labor and land costs, resulting in only a $0.21/kW-mo increase in CONE • Connecticut CONE would be even closer to ROP due to labor rates even closer to ROP’s (based on Middletown/Meriden/Bristol/New Britain/New Haven), but didn’t quantify it precisely • Energy prices have been pretty uniform across ISO-NE • Overall, the differences appear to small for us to recommend differentiating the Net CONE value across New England
Sources for Forward Curves • ICE: Obtained from www.theice.com • NYMEX: Obtained from Ventyx Velocity Suite • OTC: Compiled by OTC Global Holdings and downloaded from SNL Financial • Platts: Purchased on March 4, 2014 • Note: All futures were traded as of Feb 27, 2014, except for Platts, which was traded on March 3, 2014