Download
1 / 29
290 likes | 391 Views
Discovery of Galaxy Clusters Around Redshift 1. Deborah Haarsma, Calvin College @ GLCW, June 1, 2007. Collaborating with. Calvin College: students Andrew Butler, Katie Shomsky Michigan State University: Megan Donahue, Mark Voit, Ming Sun, student Seth Bruch

E N D
Discovery of Galaxy Clusters Around Redshift 1 Deborah Haarsma, Calvin College @ GLCW, June 1, 2007
Collaborating with Calvin College: students Andrew Butler, Katie Shomsky Michigan State University: Megan Donahue, Mark Voit, Ming Sun, student Seth Bruch National Optical Astronomy Observatory: Mark Dickinson Space Telescope Science Institute: Marc Postman Lawrence Berkeley National Laboratory: Greg Aldering European Southern Observatory: Piero Rosati University of Colorado: John Stocke
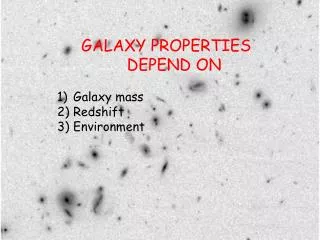
Insights into galaxy evolution from clusters • When did stars form? Single burst or long timescale? How did star formation stop? (gas stripping? winds? mergers? AGN feedback?) • How and when did galaxies assemble into clusters? Reconciling “down-sizing” with hierarchical structure formation. • How are galaxy populations in clusters still changing? Dry mergers, evolution of luminosity function. • How do the answers to these questions depend on the mass of the cluster? The density of the intracluster medium? Field vs. cluster populations? Need more z>0.8 clusters Need more x-ray luminous clusters RDCS 1252.9-2927 at z=1.24 Rosati et al 2004 AJ 127, 230 Contours = x-ray (Chandra+ROSAT) Image = B R K filters
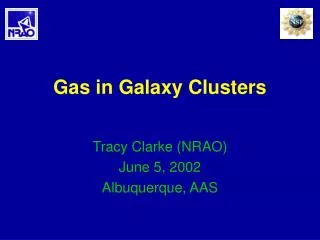
ROSAT Optical X-ray Survey (ROXS) Goal is not just finding clusters, but understanding cluster detection methods and selection functions • 4.8 sq deg • ROSAT X-ray data and Kitt Peak I-band data of whole field • “wavelet” method (Rosati) to detect extended X-ray sources • “matched filter” method (Postman) to detect concentrations of optical galaxies of appropriate brightness
ROSAT Optical X-ray Survey (ROXS) • A bimodal population? • More likely these are lower mass clusters, with x-ray emission below detection limit (Donahue et al 2001 ApJ 552, L93) 142 clusters detected in optical 43 clusters detected in X-ray 112 detected in optical but not in X-ray
ROSAT Optical X-ray Survey (ROXS) Three options: • A real cluster at z>1, failed to detect in optical due to I-band drop outs • A real cluster at moderate z, failed to detect in optical due to poorness or extent (predicted for none with z<0.4) • A constellation of X-ray point sources (predicted for 10% of the 43 X-ray sources) 142 clusters detected in optical 43 clusters detected in X-ray 13 detected in X-ray but not in optical
Bimodality of color-magnitude relation ~75% ellipticals and SOs Color Red sequence Blue Cloud ~75% spirals Magnitude Coma Cluster, z=0.023DeLucia et al, astro-ph/0610373 I-band magnitude
Observations • April 2005, KPNO 4-meter • FLAMINGOS camera, 10' field of view • 10 fields observed, containing 11 x-ray sources • 2.5 hour/field in J filter (1.2 μm), 1 hour/field in Ks filter (2.2μm) • Observations by Megan Donahue, Mark Dickinson, and Greg Aldering • Data reduction by Andrew Butler (Calvin undergrad) and Seth Bruch (then a UWisc undergrad)
Red sequence detections z~1.4 z~1.0 z~1.0 z~0.9 z~0.8 z=0.338, no I-band data z~1.0 z~0.9, no I-band data
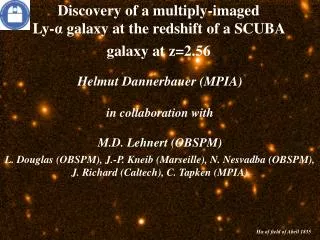
Evidence for redshifts around 1 • I-band dropout (redshifted enough to be faint in I-band) • J-K color consistent with models
Evidence for redshifts around 1 • I-band dropout (redshifted enough to be faint in I-band) • J-K color consistent with models • J-K color consistent with other clusters 0.8<z<1.2 • Brightness of BCG consistent with other clusters 0.8<z<1.2 • Colors redder than field galaxy population + Our clusters o Clusters in literature with spectroscopic redshifts 0.8<z<1.2
RXJ 1606.1+2558 • z~0.8 Color image: IJK filters Small circles: red sequence members Contours: ROSAT x-ray
RXJ 1605.6+2548 • z~0.9 • Similar color to field galaxies Color image: IJK filters Small circles: red sequence members Contours: ROSAT x-ray
RXJ 1205.2+2752 • z~1.0 • Two subclusters merging? Color image: IJK filters Small circles: red sequence members Contours: ROSAT x-ray
RXJ 1603.6+4316 • z~1.0 • Supercluster in field at z=0.9 Color image: IJK filters Small circles: red sequence members Contours: ROSAT x-ray
RXJ1416.3 Color image: IJK filters Small circles: red sequence members Contours: ROSAT x-ray • z~1
RXJ 1118.9+2117 • z~1.3 • High-z interaction? separation ~20kpc Color image: IJK filters Small circles: red sequence members Contours: ROSAT x-ray
ROSAT Optical X-ray Survey (ROXS) Three options: • A real cluster at z>1, failed to detect in optical due to I-band drop outs • A real cluster at moderate z, failed to detect in optical due to poorness or extent (predicted for none with z<0.4) • A constellation of X-ray point sources (predicted for 10% of the 43 X-ray sources) 142 clusters detected in optical 43 clusters detected in X-ray 13 detected in X-ray but not in optical
XMM archive data • 5 of 6 fields had observations in archive, 10-40ks • Analyzed by Ming Sun • Not sufficient depth to detect extended emission (cluster x-ray luminosities 1043-1044erg/s at z=0.8-1.0 would be below 5 sigma detection limit) • In all 5 cases, one or more point sources detected
RXJ1416.3: Extended ROSAT source resolved by XMM into two point sources XMM Grey: K-band Contours: ROSAT X-ray
RXJ1603: Extended ROSAT source resolved by XMM into point sources XMM Grey: K-band Contours: ROSAT X-ray
ROSAT Optical X-ray Survey (ROXS) Three options: • A real cluster at z>1, failed to detect in optical due to I-band drop outs • A real cluster at moderate z, failed to detect in optical due to poorness or extent (none predicted for z<0.4) • A constellation of X-ray point sources (predicted for 10% of the 43 X-ray sources) 142 clusters detected in optical 43 clusters detected in X-ray 13 detected in X-ray but not in optical
Conclusions • Matched filter method reliably detects low and moderate redshift optical clusters using single filter • Near infrared colors are effective for detecting z~1 clusters • Clusters can have multiple X-ray AGN. Good X-ray resolution essential for separating intracluster medium emission from AGN emission. • Find 4 to 6 new clusters, estimated redshift 0.8-1.3 (but without luminous intracluster medium) • Follow-up plans: • Gemini spectroscopy to get firm cluster redshift – IN PROGRES • Spitzer imaging for photometric redshifts, identify cluster members • Measure blue fraction (Butcher-Oemler effect), K-band luminosity function, slope & scatter of red sequence • HST imaging to classify galaxy morphologies, morphology-density relation • VLA imaging to study AGN
Flux and color calibration • Calibrated to Persson standard stars observed on same night • Checked with 2MASS stars observed in same field • Final correction using color of M-dwarf stars observed in same field
Cluster detection • Optical could be 1' or more from X-ray center due to wide ROSAT PSF and registration • Yet cluster radius is only ~20" at z=1 (0.25h50-1 Mpc) • So, require at least 4 objects of similar color, in circle 25" radius, located within 1.5' of x-ray
RXJ1416.3 Color image: IJK filters Small circles: red sequence members Contours: ROSAT x-ray • z~1
Cluster detection • Check random spots in field with same algorithm, find red sequences at 18% of locations. • Detect either: • concentrations of field galaxies • real clusters with faint intracluster medium (ROSAT constellations)