Download

1 / 16
160 likes | 271 Views
Survey Insights Canadian Champions In Training July 23, 2012. Introduction. In June 2012, Investors Group commissioned Harris Decima to undertake two online polls. Results of a poll of 183 elite Canadian athletes , “The Stuff of Champions” <hyperlink>, was released on July 17, 2012.

E N D
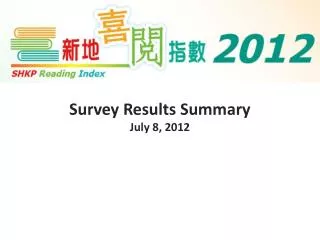
Survey InsightsCanadian Champions In Training July 23, 2012
Introduction • In June 2012, Investors Group commissioned Harris Decima to undertake two online polls. • Results of a poll of 183 elite Canadian athletes , “The Stuff of Champions” <hyperlink>, was released on July 17, 2012. • A poll of Canadian parents with children involved in sports “Champions in Training” <hyperlink> was released on July 23, 2012. • The results of the “Champions in Training” survey follow. Survey methodology: The poll was conducted by Harris/Decima between June 25 and July 1 for a total of 1,003 completed surveys. Data were weighted by age, regional and gender to reflect census profile.
Key Findings • A majority (75%) of Canadian parents with children in sports are investing time and money to foster leadership qualities, discipline and team building skills. • 56% of parents with children involved in athletic activities have two or more kids in sports. • Time and money are the greatest contributors to stress for parents with children involved in athletic activities. • Canadian parents invest an average of $1,658 per year in their children’s athletic pursuits. • On average, parents who have children participating in athletic activities spend 15 hours per month helping.
Number of Children Participating In Recreational/Competitive Sports • 56% of parents with children in sports have two or more involved in athletic activities Note: Of 1003 surveys completed, 558 participants indicated they had children currently engaged in organized athletics.
Most Stressful Aspect of Your Children's Athletic Activities • Having kids in sports demands time and money
Why Do You Invest Time/$ in Your Children's Athletics? • A majority of Canadian parents cite character development as the main incentive of athletics – though many believe they are fostering a recognized talent.
Hours/Month Spent Helping Children • Parents nation-wide spend on average 15hrs/month on non-monetary support helping out.
$/Year Spent on Children's Athletics • Canadian parents invest an average of $1,658 per year in their children’s athletic pursuits.
% of Income Lost From Time Off Work For Children's Athletics • More than a quarter of households surveyed are losing some portion of potential earnings as a result of time spent on their children’s athletic endeavors.
$ Used For Children's Athletics Is: • Despite the earnings spent and foregone, a significant majority of athletes’ parents see athletics spending as a parental responsibility.
Why Do You Invest Time/$ in Your Children's Athletics? • Ontario parents are more likely to say their children involved in athletics have special talents or skills • BC parents anticipate financial advantages from their children’s involvement in sports - more so than other regions. • Atlantic Canadians indicate less interest in elite athletics, viewing athletics as a social experience rather than a developmental tool. Legend: grey express lowest, blue express highest
Hours/Month Spent Helping Child By Region • BC and Prairie parents spend the most time on average volunteering to help.
Average Amount ($/Year) Spent on Children’s Athletics • Parents in BC spend 124% of the national average in terms of children’s athletics. • The Atlantic provinces spend 65% of the national average.
What Sacrifices Have You Made to Fund Your Children’s Athletics? • Families in the Prairie provinces are most likely to say they have sacrificed personal expenditures on shopping, entertainment or family vacations.