Download
1 / 32
320 likes | 346 Views
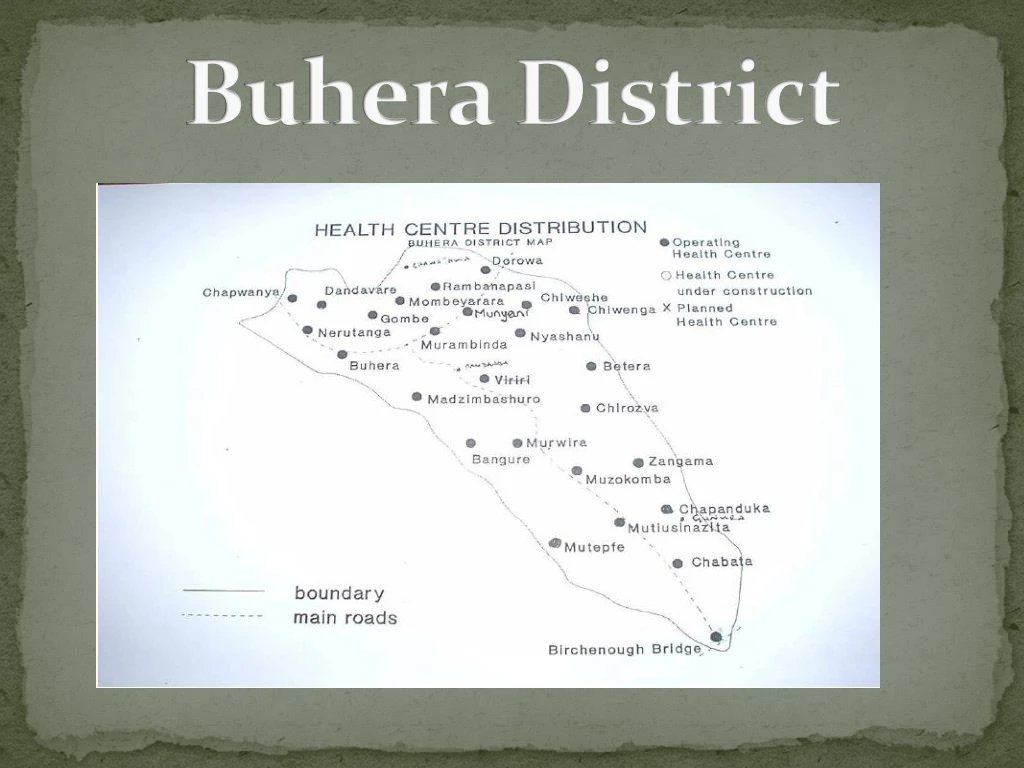
Buhera District. Demographic Data. Total Tuberculosis diagnosis per year in Buhera District. Notification rate of all TB cases per 100 000 population. Patients from outside Buhera District as from 2005 - 2011. Proportion of patient age groups.

E N D
Proportion of new TB cases versus retreatment cases per year
Active Screening of TB to HIV positive clients in Buhera district as from June 2010
Tuberculosis diagnosis facilitated by sputum collection from clinics versus hospitals
Total patients diagnosed TB, as a result of sputum collection from clinics from year 2008 - 2010
Total Tuberculosis diagnosis per quarter for the past six years in Buhera District
Results of smears examined for culture and sensitivity tests
Percentage of Smear examination results of all PTB cases diagnosed
Percentage of Smear examination results of all PTB cases diagnosed
PTB smear examination results of cases diagnosed in Buhera in years 2006-2011
Treatment outcome for PTB SS –ve, ND and EPTB clients by year
What proportion of TB patients not knowing their HIV status at diagnosis have been offered an HIV test?* *Excludes those known to be HIV positive
Partners involved in TB and HIV • MSF-B • TB Alert • NAC • New start and New life • Dananai, Rujeko and CARC • There are other partners involved in prevention and management
Achievements • We now have 27 OI sites • 10 were assessed to be stand alone sites but only 6 passed • MSF-B has acquired the Gene Expert Machine for BBH • Support and supervision visits being conducted quarterly
Challenges • High workload versus staff shortage • Shortage of fuel for support and supervision • Management of MDR-TB • High defaulters