Download
1 / 10
120 likes | 389 Views
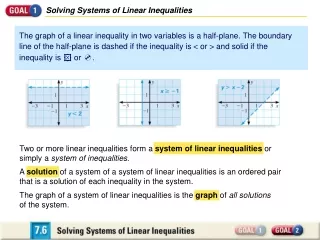
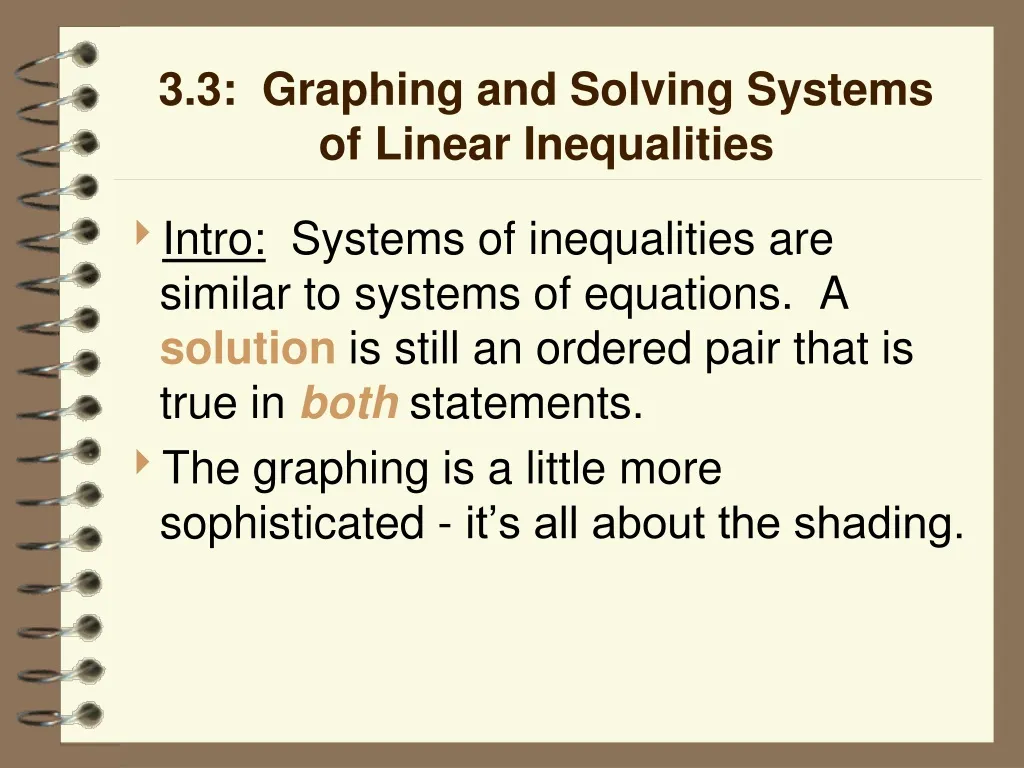
3.3: Graphing and Solving Systems of Linear Inequalities. Intro: Systems of inequalities are similar to systems of equations. A solution is still an ordered pair that is true in both statements. The graphing is a little more sophisticated - it’s all about the shading. Graphing Method.

E N D
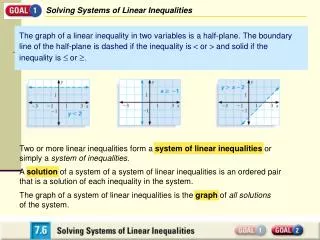
3.3: Graphing and Solving Systems of Linear Inequalities • Intro: Systems of inequalities are similar to systems of equations. A solution is still an ordered pair that is true in both statements. • The graphing is a little more sophisticated - it’s all about the shading.
Graphing Method • Example: Graph the inequalities on the same plane: x + y < 6 and 2x - y > 4. • Before we graph them simultaneously, let’s look at them separately. • Graph of x + y < 6. --->
Graphing Method • This is: 2x - y > 4. So what happens when we graph both inequalities simultaneously?
Coolness Discovered! • Wow! • The solution to the system is the brown region - where the two shaded areas coincide. • The greenregion and redregions are outside the solution set.
So what were the steps? • Graph first inequality • Shade lightly (or use colored pencils) • Graph second inequality • Shade lightly (or use colored pencils) • Shade darkly over the common region of intersection. • That is your solution!
Challenge Extended Graph y ≥ -3x -1 and y < x + 2
What about THREE inequalities? • Graph x ≥ 0, y ≥ 0, and 4x + 3y ≤ 24 • First off, let’s look at x ≥ 0 and y ≥ 0 separately.
Graphing THREE inequalities • Now let’s look at x ≥ 0 and y ≥ 0 together. Clearly, the solution set is the first quadrant.
Graphing THREE inequalities • So therefore, after we graph the third inequality, we know the solution region will be trapped inside the first quadrant. So let’s look at 4x + 3y ≤ 24 by itself.
Graphing THREE inequalities • Now we can put all of our knowledge together. • The solution region is the right triangle in the first quadrant.