Download
1 / 16
170 likes | 286 Views
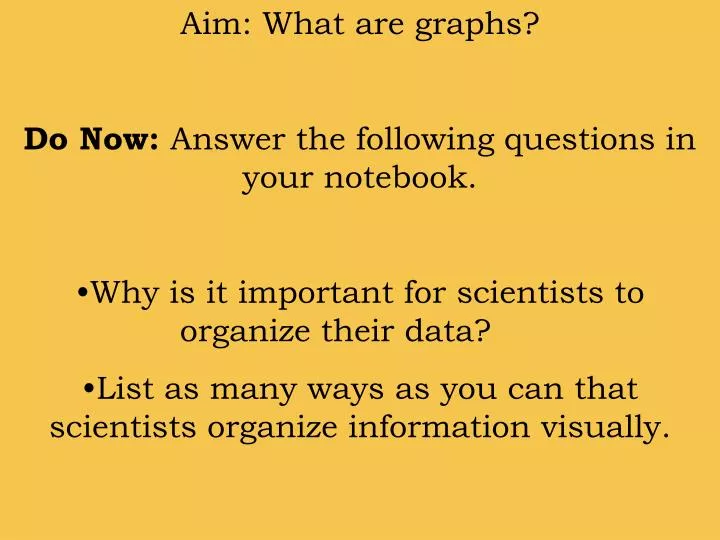
Aim: What are graphs? Do Now: Answer the following questions in your notebook. Why is it important for scientists to organize their data? List as many ways as you can that scientists organize information visually.

E N D
Aim: What are graphs? Do Now: Answer the following questions in your notebook. • Why is it important for scientists to organize their data? • List as many ways as you can that scientists organize information visually.
A graph is a way in which to visually show information. Graphs allow for easy comparison of multiple variables. Graphs are constructed from data table. - include headings, units, and data. * In Earth Science we will usually create line graphs.
I. Graph Parts • The horizontal axis is the X axis. It usually displays the independent variable. • The vertical axis is the Y axis. It usually displays the dependent variable. * EVERY graph needs a title.
The Independent Variable is controlled by the experimenter (x-axis). This could be: • time (dates, minutes, hours), • distance (feet, meters), The Dependent Variable is directly affected by the independent variable (y-axis). It is the result of what happens because of the independent variable.
II. Graphing Relationships Indirect / Inverse Direct Cyclic Direct relationship- as x gets bigger, y gets bigger. For example, the relation ship between age and size (until maturity) is a direct relationship. Indirect / Inverse- as x gets bigger, y gets smaller. For example, the relationship between time spent at the mall and the amount of money in your pocket is an inverse relationship. Cyclic- a repeating pattern.
Most relationships in Earth Science are cyclic. Can you think of an cyclic relationships or “cycles” that occur on Earth? Closure: When done, obtain a Graphing Review worksheet from the back top bin.
Scaling Overview AIM: How do you scale a graph?
When you graph, make sure you: • Have a proper title that describes the graph • Plan out your scaled axis before actually writing them • Label the x-axis and y-axis appropriately
One box along the x- axis is equal in length to one box along the y-axis.
Rate of Change • The rate of change measures the amount of change taking place in a given amount of time. • This equation is found on page 1 of the Earth Science Reference Tables: • Rate of Change = Change in Field Value Change in Time
Field value = what was being measured • Change in time = the amount of time it took for the change to occur Rate of Change = Change in Field Value Change in Time
Example Problem • Example: The temperature in a greenhouse is 10 degrees C at 12:00 a.m. At 3:00 a.m., the temperature is 5 degrees C. • At what rate did the temperature change? • There is a 5 degree C change in 3hrs. (5 degrees C / 3 hrs) Rate of change = 1.7 degrees C/hr.
Do now: - Take out your scaling a graph I and II. - I will be coming around to check scaling a graph II. - From your Scaling a graph I worksheet, find the rate of temperature change from January to July Rate of Change = Change in Field Value Change in Time
Rate of Change = Change in Field Value Change in Time
From your Scaling a graph II worksheet, find the rate of temperature change from July to December. Rate of Change = Change in Field Value Change in Time